Plenty of pundits, including me, have been fretting about the US market for at least three years now. For all that time, US stocks have looked expensive but share prices have carried on rising. And that's still the case this week. Amazon's share price has jumped 13% over the last week while shares in Facebook have climbed 6%.
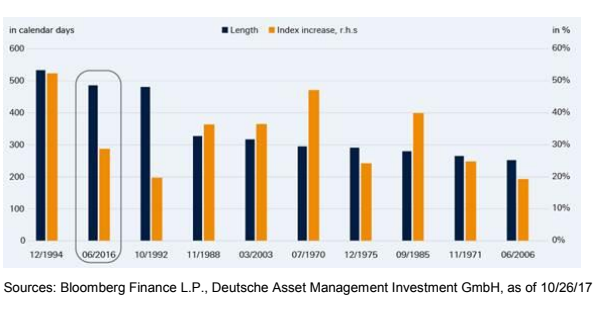
Deutsche Asset Management's 'Chart of the week' provides further evidence of the strength of this bull market.

In late June 2016, US equity markets fell 5% in the immediate aftermath of the Brexit referendum. This downtrend didn't last long, US share prices were rising again by the beginning of July, and there hasn't been a pullback as big as 5% since then - a period of 490 days. Deutsche says this is the second longest such period since 1970. The longest period without a 5% pullback was between December 1994 and May 1996.
However, the interesting thing about the last 490 days is that the overall rise has been relatively weak - the S&P has risen by around 30% over that period. As you can see from the chart, there are five periods where share prices didn't pull back significantly for some time but also managed to rise by more than 30%. Indeed share prices rose by over 50% between December 1994 and May 1996.
So US share prices have been rising for a long time but not that quickly. It's hard to know why that is for sure, but perhaps it reflects a widespread nervousness about the US market. Investors have been hanging onto their shares but not buying too many more.
Is the US expensive?
If you're wondering what you should do vis a vis the US market, it's essential that we look at valuations. And if you use the Schiller CAPE ratio (cyclically adjusted price earnings), the US market certainly looks expensive. The CAPE ratio currently stands at 31, which isn't its highest level ever but is way higher than its long-term average of 16. (The CAPE ratio is calculated by comparing share prices with company earnings over the last ten years. This helps to smooth out any short-term in volatility in earnings.)
And some large US companies look very expensive at first glance. Amazon, for example, is trading on a price/earnings ratio of 190.
I share these concerns about US valuations, at least partly. I have cut back on my US investments over the last year, but I still hold some US shares including Amazon. I shall probably carry on holding them too. I think you can't ignore the fact that the US is still the most vibrant economy in the world and it's where a huge number of the world's best companies are located.
Amazon is one of those companies and I've held onto my shares in the company because I'm sure that Amazon could quickly boost profits if it wanted to. But as has been the case throughout its history, Amazon is focusing on investment to boost its business still further.
The issue with the US market is there hasn't been a major event or trigger to push share prices down. If Trump's proposed tax cuts don't come through, that could be the trigger for a significant fall, but I'm trying not to worry too much. I'm a long-term investor and I can cope with some turbulence, so I probably won't sell any more US shares.
It's also worth noting that there are some parts of the market which may still be relatively cheap. I interviewed the well known investment strategist, Rob Arnott, last week and he said that US value was still 'modestly cheap.'
If you wanted to invest in US value stocks, one approach would be a smart beta ETF that focused on the value factor. One example is the ishares Edge MSCI USA Value Factor UCITS ETF (LSE: IUVF) in which I have a small investment. Just remember that Arnott said US value was 'modestly cheap.' Even US value shares aren't exactly cheap.


