Crude oil prices jumped to a six-month high earlier this week after the US announced it would end all exemptions for sanctions against Iran.
Even after a 3% fall today, Brent Crude is up 34% so far this year and is trading at $71.62.
Oil prices are largely governed by supply and demand, but geopolitical events can also impact the price. These price movements are often felt across other markets and being exposed to certain countries or asset classes alongside the movement of oil can – in some bases - be beneficial.
The recent news that the US said it was ending all exemptions for sanctions against Iran not only prompted crude oil prices to rally, but also prices in other markets to do well.
It also announced that from May the US will come down hard on countries that purchase crude oil from Iran, such as China, India and other markets. In response to this Iran has threatened to shut the Strait of Hormuz – one of the world’s busiest maritime transit routes for shipped oil.
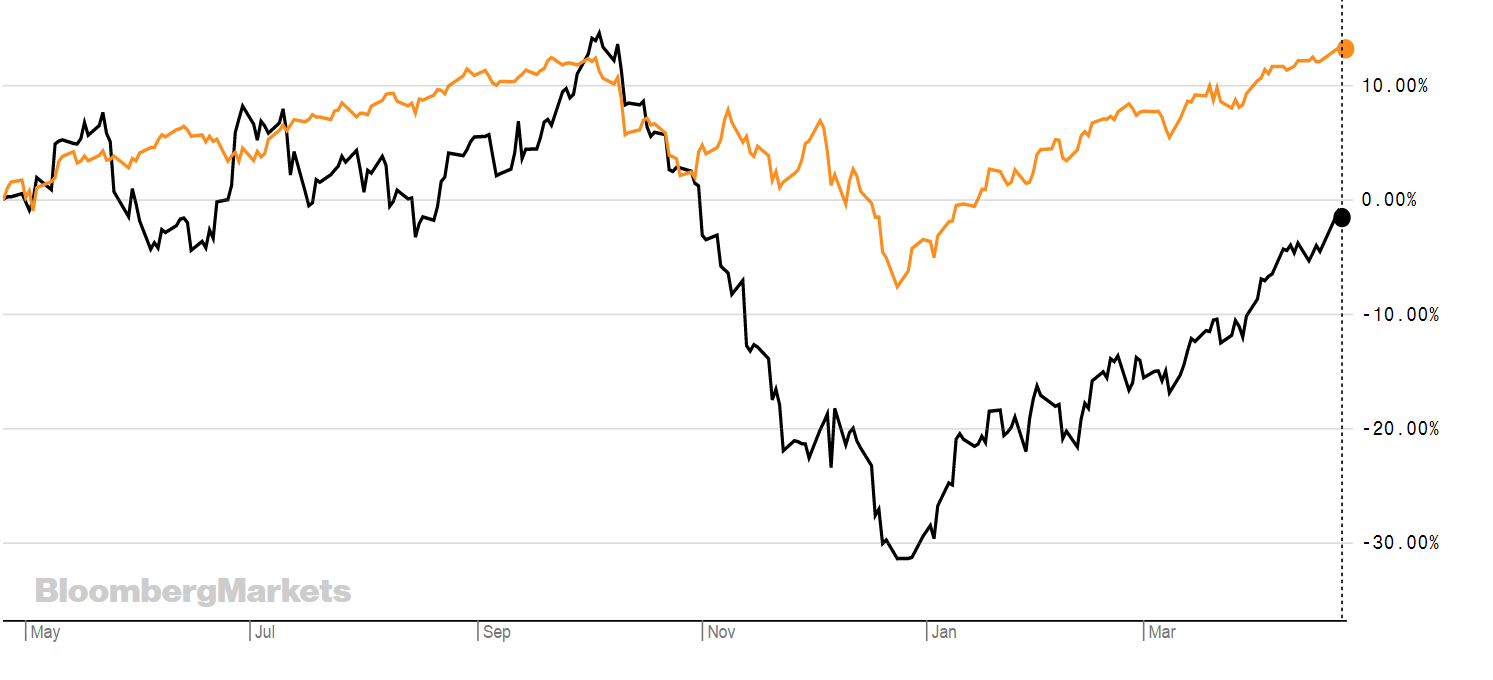
ETFS WTI Crude Oil ETP (CRUD) from ETF Securities has returned 40.13% and is shown below with the iShares S&P 500 Core ETF (CSPX) in orange.
Source: Bloomberg
Barclays commented in a note following the US announcement: “We were expecting the 180-day significant reduction exemptions (SREs) given to eight countries in November last year (expiring on May 2) to be rolled over at a reduced level. However, today’s announcement by the US Secretary of State, Mike Pompeo, re-iterating the ‘Zero Exports’ target for Iranian crude oil resets those expectations, implying material upside risk to our current $70/b average price forecast for Brent this year, compared with the year-to-date average of $65/b.”
As a result of these announcements, in the short-term Asian countries are likely to be hit hard by this. However, some countries are also likely to benefit. Saudi Arabia is possibly one of these. It - and the UAE - are likely to be the ones that increase output to help make up for the loss from Iran.
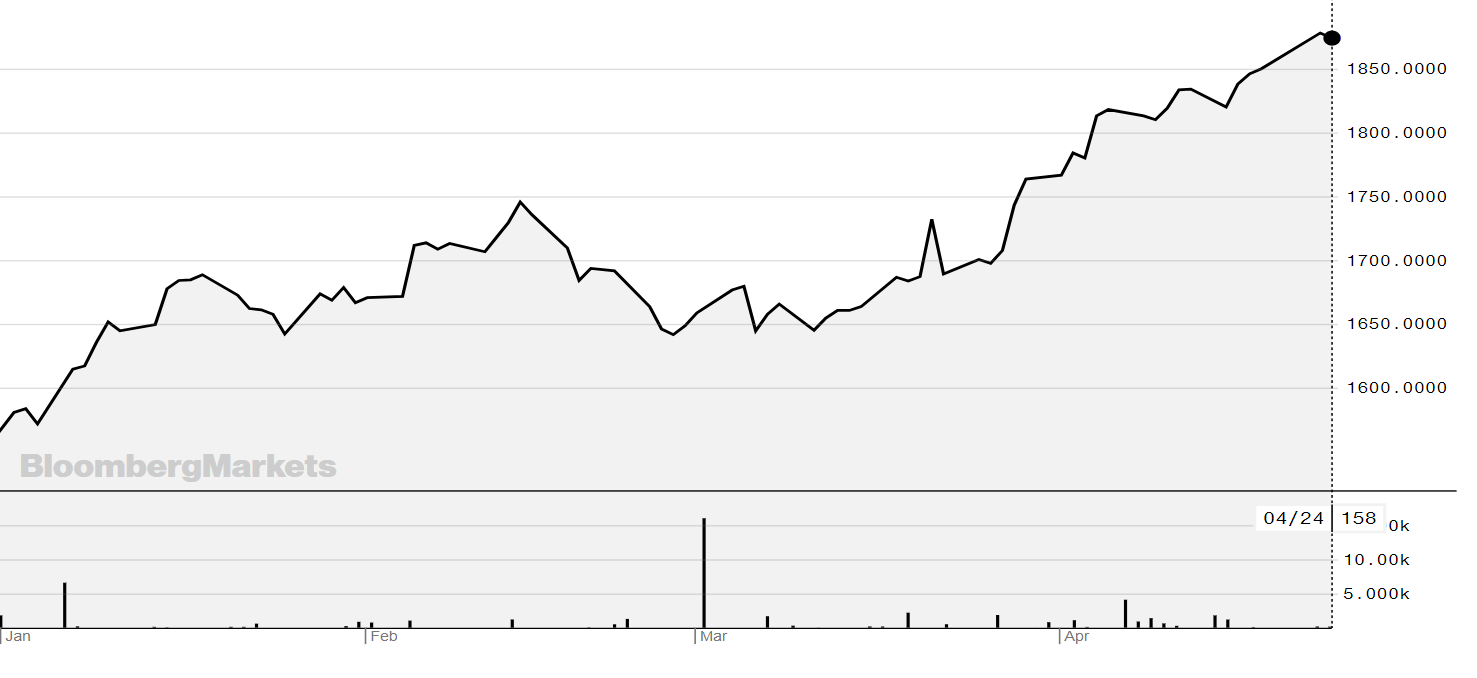
There is only one ETF offering exposure to Saudi Arabia on the London Stock Exchange – Invesco’s MSCI Saudi Arabia ETF (MSAP) – but it has returned over 20% YTD.
Source: Bloomberg
Australia is also likely to benefit from this set up. The iShares MSCI Australia ETF (SAUS) has returned 12% YTD.
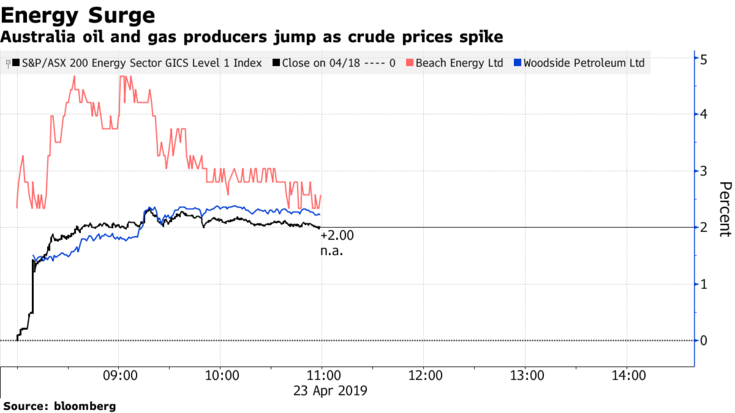
Turning to the US, Uncle Sam could do with prices coming down and output increasing. It is in the interest of the US to keep oil prices low. MoneyWeek reported that the price of petrol in the US is near an all time high, something that Trump will be keen to avoid.
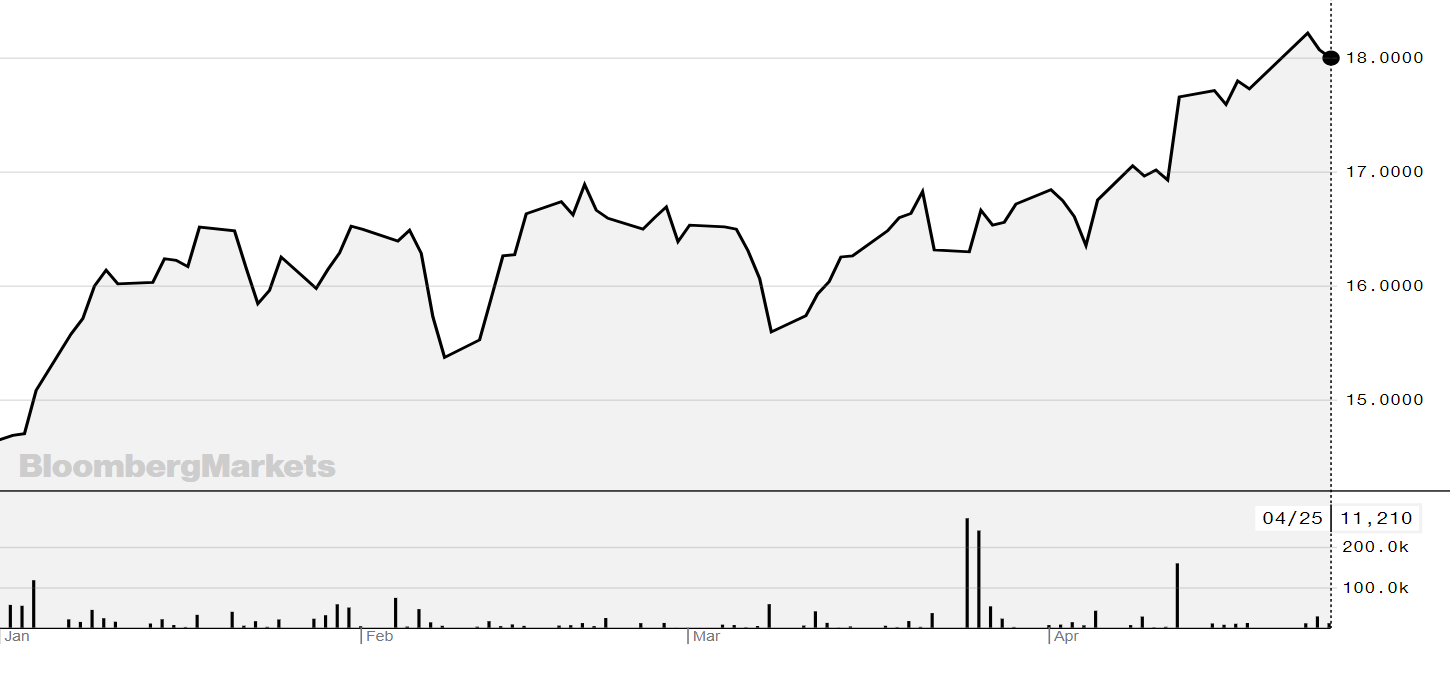
Oil exploration and production companies have also done well this year. Something that - should oil inventories get cut - could become more important. The iShares oil and gas exploration and production ETF (IOGP) has returned 23% YTD (see graph below).
Source: Bloomberg
There is also a chance that oil prices will keep rising, which could have a negative impact on markets globally.
According to ETF Daily News; Oxford Economics economist John Payne said: “Were [Brent] oil to increase to $100 [per barrel] by Q4 2019, simulations suggest the level of global GDP would fall 0.6% below baseline by end of 2020, and inflation would rise 1.5% above it by Q1 2020.” (see chart below).
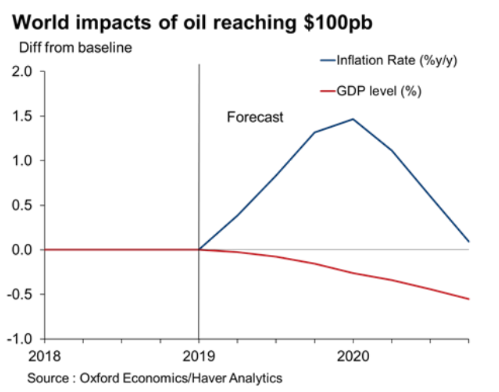
Source: Oxford Economics
According to the note, it would mean inflation would average 4% year-over-year in 2020, the sharpest spike in prices since 2011. Global GDP growth would also drop to 2.5% in 2020.
A spike in oil prices would be “particularly damaging for already-fragile, oil importing emerging markets,” such as the Philippines, Argentina, Turkey and Indonesia,” but those that stand to benefit most would be oil exporters Russia, Saudi Arabia and U.A.E., they said.
However, few market watchers believe that oil prices will continue rising substantially.
Barclays commented in its note that it [on ‘zero-exports’] doesn’t affect its view on longer-term prices materially, the short-term upside risk to prices is based on a) our view that Saudi Arabia’s response will likely be lower and slower compared to late last year and b) heightened risks of the closure of the Strait of Hormuz as a result of this action.
Oxford Economics also notes that Brent prices are likely to bottom out at $63 this quarter, before slowly rising back to an average of $64 in 2019 and $66 in 2020, and 2019 GDP growth bottoming out at 2.6% in Q1 before recovering up to an average 2.9% through 2020.
While the only sure bet with oil is that it will be volatile, it’s also helpful to remember that the market is currently risk-on, which tends to tie in with oil prices going up.
Below is a table that includes some of the ETFs and ETPs offering access to the markets mentioned above or with exposure to oil listed on the London Stock Exchange.
IOGP
CRUD
FCRU
LOIL
MSAP
MSAU
SAUS
IAUS
AUGA
LAUU
ETFYTD RTNTERUNDERLYINGiShares oil and gas exploration and production ETF23.11%0.55%the Fund aims to track the performances of the S&P Commodity Producers Oil & Gas Exploration & Production IndexSPOG21.57%0.55%the Fund aims to track the performances of the S&P Commodity Producers Oil & Gas Exploration & Production IndexETFS WTI Crude Oil ETP40.13%0.49%Bloomberg WTI Crude Oil Subindex Total Return (previously DJ-UBS)ETFS Longer Dated WTI Crude Oil35.88%0.49%Bloomberg WTI Crude Oil Subindex 3 Month Forward Total Return (previously DJ-UBS)ETFS 2X Daily Long Wti Crude Oil ETP89.49%0.89%It will provide a total return equal to two times (2x) the daily change in the Bloomberg WTI Crude Oil Subindex (previously DJ-UBS) plus a collateral yieldUBS ETC linked to UBS Bloomberg CMCI Components USD Total Return WTI Crude Index OILU32.26%0.30%UBS Bloomberg CMCI Components USD Total Return WTI CrudeInvesco MSCI Saudi Arabia UCITS ETF21.49%0.50%MSCI Saudi Arabia 20/35 Index less fees, expenses and transaction costs. The reference index is a free float adjusted market cap index designed to measure the large and mid-cap segments of the Saudi Arabian market.Invesco MSCI Saudi Arabia UCITS ETF23.00%0.50%MSCI Saudi Arabia 20/35 Index less fees, expenses and transaction costs. The reference index is a free float adjusted market cap index designed to measure the large and mid-cap segments of the Saudi Arabian market.iShares MSCI Australia UCITS ETF12.34%0.50%MSCI Australia IndexiShares MSCI Australia UCITS ETF13.48%0.50%MSCI Australia IndexUBS Irl ETF plc - MSCI Australia UCITS ETF13.58%0.50%MSCI Australia IndexLyxor Australia S&P/ASX 200 UCITS ETF13.95%0.40%S&P/ASX 200 index (Australian market) denominated in AUD


