Anthony Renshaw (pictured), director of index solutions at Axioma Investment takes a deep dive into the inconsistencies in the way environmental, social and governance (ESG) issues are measured between different providers. While there have been numerous ESG methodology studies, the asset management industry is yet to find a one size fits all solution meaning metrics can vary from one provider to the other. Is there a solution to this issue?
Several recent press articles have highlighted inconsistencies in ESG scores across different vendors, which is troubling given ESG’s increasing use in investing. In our recently published paper, A Survey of ESG Vendor Data: Strategies for Managing Score Differences we looked at data from four ESG vendors and analyzed how pervasive ESG disparities are, where they arise, and what could be done to develop a more consistent ESG taxonomy. In this article, we highlight some of those findings from the research. In a nutshell, we find inconsistencies of varying degrees across individual E, S, G components.
Breaking down the E, S, Gs: Industry Average E (Environmental) Scores
Table 1 below lists the scores available to us from each of four ESG vendors. Vendor A gives its E score in USD (e.g., millions of dollars of greenhouse gases, carbon emissions, etc.); vendor B reports its E score as a percent of company revenue (e.g., dollars of environmental impact divided by company revenue); vendors C and D give scores between 0 and 100 for E, S, G, and ESG combined.

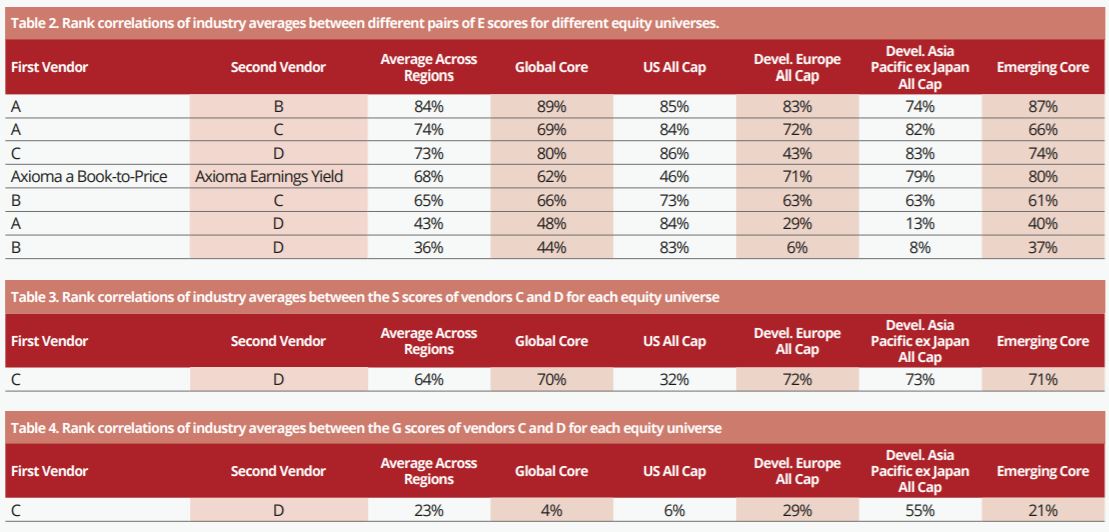
One method to assess the consistency of the E scores is by computing the rank correlations of industry averages across different equity universes. Table 2 shows the rank correlations of the average GICS industry E scores across the four vendors between the different pairs of E scores for several equity universe as of the end of August 2018. Also included in the table is the industry-industry rank correlation for the Axioma Book-to-Price and Earnings Yield factors, as given by the Axioma Global Equity Fundamental Factor Risk Model (AXWW4-MH). The comparison of these two value descriptors provides a benchmark for the kind of rank correlation (68%) to expect from a well-known, traditional pair of similar (but not identical) factors. The table also shows the average rank correlation across each of the five regions.
All of the rank correlations in Table 2 are positive, most strongly positive, indicating that they are all capturing the same sense of E. A couple of the rank correlations are larger than the Axioma value pair rank correlation, and even the lowest regional average rank correlation (36% between B and D) is reasonably high and positive. The correlations in the US universe are particularly high (minimum of 73%) across all pairs (except the Axioma value pair). E scores therefore show a high level of consistency across vendors.

S (Social) Scores
Next, we examine the consistency of S (social) scores between vendors C and D (vendors A and B only provide E scores). Ideally, we would report results with more than two data vendors but as we cannot, we should avoid over-generalizing the following findings. Table 3 shows the rank correlation of the GICS industry average S scores for each equity universe. All the correlations are about 70%, with the exception of the US All Cap universe, which only has a 32% rank correlation. There appears to be reasonable agreement between these two S scores, particularly outside of the US. So, from the point of view of rank correlation, the S scores are fairly consistent.
G (Governance) Scores
Finally, we examine the consistency of G (governance) scores between vendors C and D. Table 4 shows the rank correlation of the GICS industry average G scores for each equity universe. The G score correlations are notably lower than those for E and S (with the exception of the AsiaPacific universe).
The fall-off in correlation (and therefore consistency) is perhaps expected. The E and S scores are linked, at least in part, to what each industry does. Governance, on the other hand, is an equal opportunity factor: any company in any industry can be well managed. This lack of industry influence appears to lead to less consistency in the G scores for these two vendors.
Conclusion
As more vendors enter this space and more work is done to standardize the ESG definitions, we think that in the near-term, granular scores (E, S, G, and sub-components of these) should be considered over composite ESG scores. Portfolio managers could integrate the ESG characteristics most important to them to ensure they are correctly reflected in their portfolios. For the limited data set available to us, we found that the E score has the highest consistency, followed by S scores. G scores appear to require care due to their relatively poor consistency.
Anthony Renshaw is director of index solutions at Axioma Investment
This article first appeared in the Q2 edition of our new publication, Beyond Beta. To receive a full copy, click here.


