The importance of getting the asset allocation decisions right has long been engrained in the thinking of investors and financial professionals. The difficulty has been how to get outside the realm of the subjective and have an approach that delivers consistently. A large body of academic research - much of it by my partners and co-founders of Parala - has long identified that understanding the state of the macro-economy and how it is evolving can be very useful in determining investment asset returns. At Parala, our combined skills and pioneering insights on financial market behaviour has resulted in a state-of-the-art investment methodology able to forecast the movement of security prices by modelling the correlation of macro-economic variables to individual assets and to factors that have been shown to drive market performance. The methodology is distinguished by its ability to learn and adapt across time and to quickly respond to fast-changing landscapes. It underpins the multi-asset solutions we provide for our institutional clients and the funds we advise.
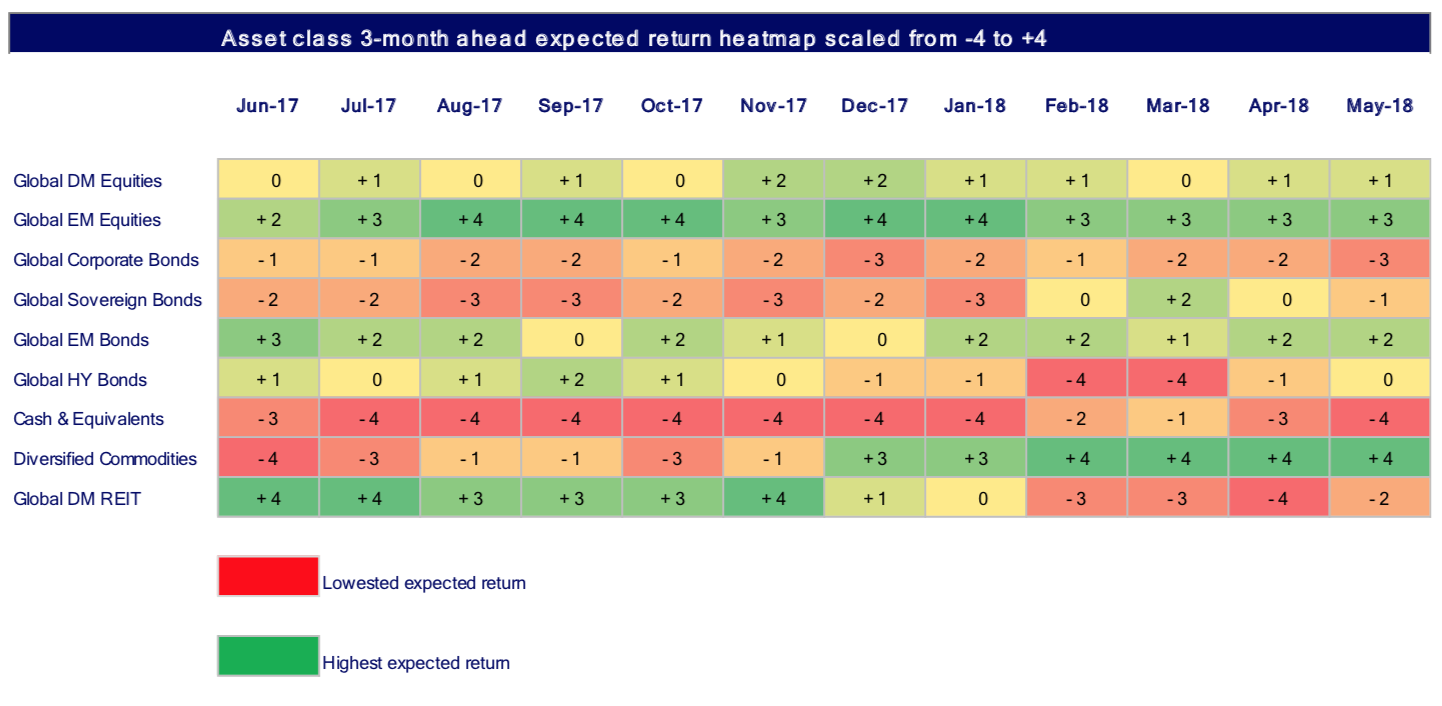
Parala's approach is straightforward and intuitive but one which requires highly complex and proprietary calculations to execute effectively. We've found that a simple way of expressing changes in expected investment outcomes is to use heatmaps. The heatmap below covers nine major asset classes. It shows a three-month ahead view of expected performance from May 2018 as well as the previous forecasts over the last year. The investor currency for expected returns is GBP and assumes that fixed income investments are currency hedged. Forecasts are updated each month with the latest macro-economic and risk factor changes.
What is our model telling us about key developments across asset classes for the coming months? A good place to start is considering some of the key macro trends that we have recently observed:
USD currency has declined on a year-over-year basis against major trading partners but strengthened in recent months.
Short term interest rates continued to rise which is negative for fixed term assets.
Economic growth is positive as indicated by year over year increases in commodities.
The yield curve has flattened and may be indicative of broader investor concerns.
Equity volatility measured by the VIX Index declined following three months of rising volatility which may indicate investors are more sanguine about near-term equity risks.
These macro variables and many others are part of the information set we use to generate forecasts which can then be distilled into rankings and the heatmap below.

A nice thing about the table is that it can be used to assess the relative attractiveness of different asset classes at a point in time as well as trends in individual asset class expectations across time with the more attractive potential returns moving from red to green.
So, what are the observable trends and what might we expect in terms of asset class relative returns over the next three months?
Here are some takeaways:
Diversified commodities have the most favourable ranking over the coming 3-months followed by emerging market equities.
Among fixed income asset classes, EM bonds have the most favourable ranking and corporate bonds the least favourable.
Cash equivalents are the least favourable area to invest followed by corporate bonds.
This month we also take a deeper dive into equities.
What are the key market movers and what can we expect from equity markets over the coming three months?

EM equities have the most favourable ranking over the coming three months followed by Asia ex-Japan equities.
European small caps have the least favourable ranking from by UK large caps.
UK large caps have fallen the most in the rankings since last month and UK small caps have shown the most improvement.
Small caps are more influenced by changing domestic business conditions than international ones which may make UK smaller companies less affected by the uncertainty of Brexit compared to larger UK companies.
Our state-of-the-art investment model is constantly learning and adapting to changing macro-economic and market conditions. Next month, we will provide an update to our three-month ahead view and take a deeper look into another asset class.


