China has had a rough year, including trade tensions with the US, a downgrade in economic growth and the yuan fell throughout the year. But fortunes might be changing, with risks of the trade war stabilising and markets picking up.
Last year China's GDP slowed - The FT reported that China's GDP grew by only 6.4% in 2018, the lowest growth rate in three decades. It has been attributed to two factors: a shift in policy towards paying off debt, and a knock to confidence from trade war fears.
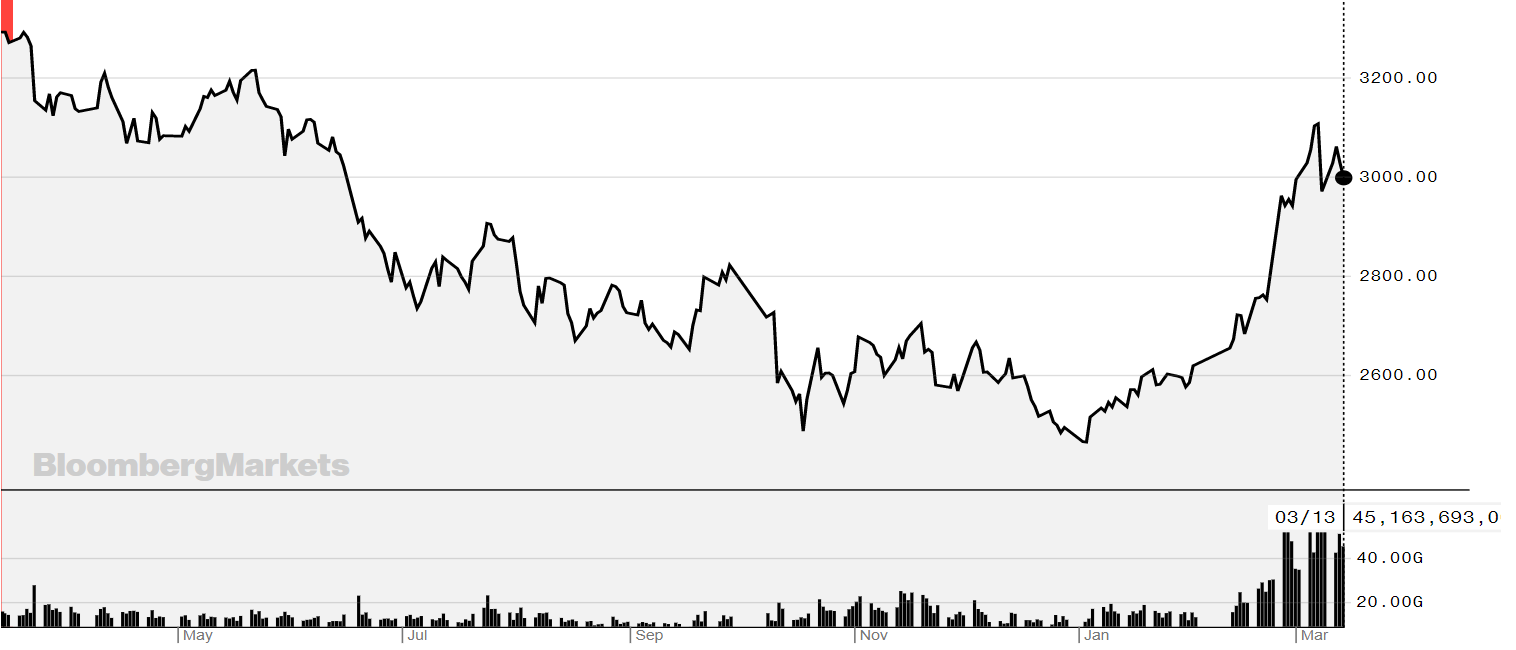
Alongside this, China's benchmark index, the Shanghai Stock Exchange Composite index (see graph below), also tanked in 2018.
Source: Bloomberg
However, this year things are picking up.
Year-to-date the index has returned nearly 20%, reversing some of the -24% fall last year.
The Shanghai Stock Exchange Composite index is a capitalization-weighted index. The index tracks the daily price performance of all A-shares and B-shares listed on the Shanghai Stock Exchange.
So, why are things picking up suddenly after two years of disappointment?
It doesn't hurt that the value of Chinese stocks is low after falling for two years. Buy low and sell high, seem to be the obvious point here. And there could still be more on the upside.
Gaurav Saroliya, director of macro strategy at Oxford Economics, told MarketWatch that they don't think the rebound in Chinese equities and the yuan is done. "Like with most global risk assets, the recent pace of gains was unlikely to be sustained and a pause was healthy."
There are also other supportive factors for China.
Firstly, the so-called trade war between China and the US seems to be abating. Gavyn Davies in the FT wrote recently: "Markets have already priced in a successful outcome and it seems reasonable to assume that the damage to economic confidence more generally will abate in coming quarters."
Another reason is MSCI announced this month plans to increase the weight of China A-shares in the MSCI indices by raising the inclusion factor from 5% to 20% by November. This is a sure sign that China is opening its capital markets.
Remy Briand, MSCI Managing Director and Chairman of the MSCI Index Policy Committee, said in a statement from MSCI: "The strong commitment by the Chinese regulators to continue to improve market accessibility, evidenced by, among other things, the significant reduction in trading suspensions in recent months, is another critical factor that has won the support of international institutional investors."
Chinese government bonds are also going to be included in the Bloomberg Barclays Global Aggregate index as of next month, which will also boost flows into the region.
Tang Yao, Guanghua School of Management, Peking University, told The Telegraph: "As global central banks shift to a more relaxed monetary policy, the pressure on the yuan's exchange rate will continue to alleviate, meaning China has increasing room for monetary easing.
"It is evident that the Chinese economy is far from undergoing a precipitous fall, and the employment level is stable. Policymakers are thus expected to weigh the effects of the combining policies already introduced, and interest cuts are not needed to stabilise its economic fundamentals."
Access to China is easier now than ever before with an increasing number of ETFs on offer. However, not all track the same indices and they give different exposure to China, which is something to be aware of.
For example, the iShares MSCI China A ETF (CNYA) has a TER of 0.65%, is physically backed and has returned 22.92%YTD. This compares with the Xtrackers FTSE China 50 UCITS ETF, which has a TER of 0.6% and a current management fee of 0.40% has returned only 11.31% this year. The reason for this is the make up of the index, the FTSE A50 index only has exposure to the top 50 largest and most liquid chinese stocks. This compares with the MSCI China A index, which includes large and mid-cap representation across China securities listed on the Shanghai and Shenzhen exchanges.
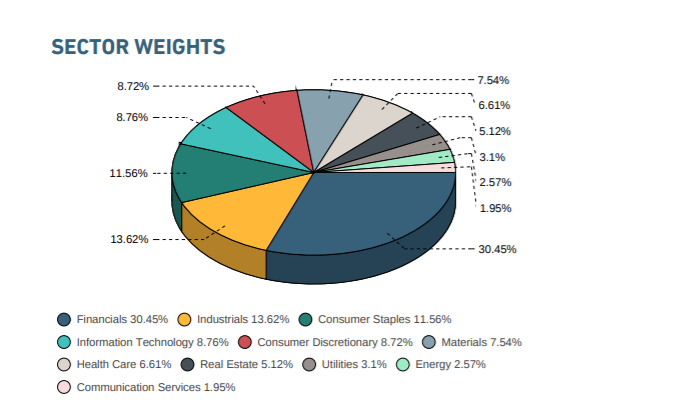
The sector weights on MSCI's China A index are seen below:
Source: MSCI
However, something to bear in mind is that over the past five years, it has been the FTSE A50 that has performed best (see graph below). This shows XX2D in black, CNYA in yellow and IDFX in orange.
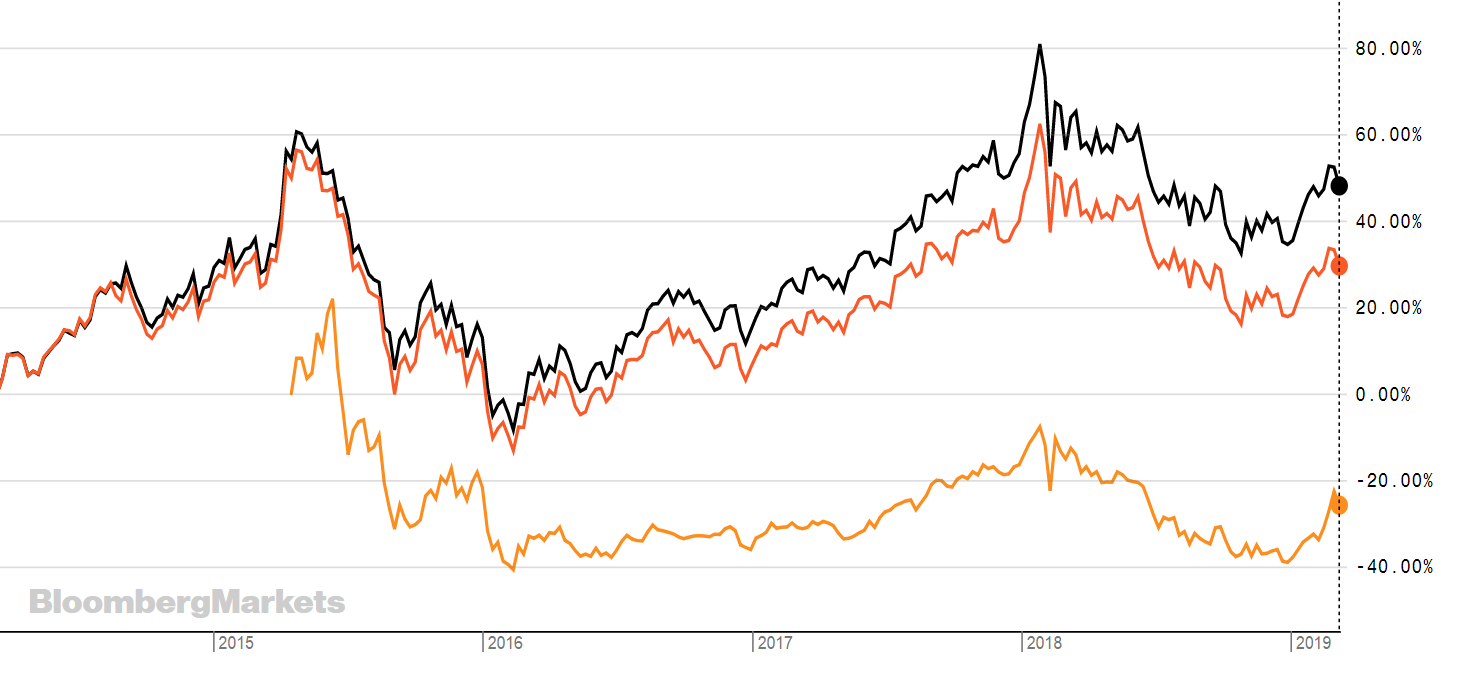
Shaun Port, CIO at Nutmeg, previously told The FT that "the determining factor of which index has done best has been which have the greatest exposure to technology stocks [which have rallied strongly in recent years]."
It helps to know what kind of access you want and this requires some level of due diligence. The indexes are different and so are the expense ratios, which can go north of 1%.
Here is a non-exhaustive list of the China ETFs available on the London Stock Exchange with their YTD performance to 14th March 2019.
RTN
CNYA
IASH
AH50
M'ment Fee: 0.45%
PRCE
PRCU
CHNA
CHNP
CASH
CASE
CNAA
CNAL
RQFI
M'ment Fee: 0.45%
ASHR
M'ment Fee: 0.35%
HMCD
HMCA
ASIU
ASIL
XX2D
TER: 0.60%
XX25
TER: 0.60%
XCX6
M'ment Fee: 0.45%
XCS6
M'ment Fee: 0.45%
LCCN
IDFX
HMCH
HMCT
ETFTERYTD INDEXiShares MSCI China A UCITS ETF USD Acc0.65%22.93%MSCI China A IndexiShares MSCI China A UCITS ETF USD Acc (GBP)0.65%18.31%MSCI China A IndexXtrackers Harvest FTSE China A-H 50 UCITS ETFTER: 0.65%20.62%FTSE China A-H 50 IndexGF International-FTSE China A UCITS ETF0.35%24.09%FTSE China A IndexGF International-FTSE China A UCITS ETF0.35%19.37%FTSE China A IndexCSOP Source FTSE China A50 UCITS ETF0.65%23.33%FTSE China A50 IndexCSOP Source FTSE China A50 UCITS ETF (GBP)0.65%18.78%FTSE China A50 IndexL&G E Fund MSCI China A UCITS ETF0.88%23.71%MSCI China A IndexL&G E Fund MSCI China A UCITS ETF (GBP)0.88%18.91%MSCI China A IndexLyxor Fortune SG MSCI China A DR UCITS ETF0.65%25.55%MSCI CHINA A ONSHORE Net Return Index USDLyxor Fortune SG MSCI China A DR UCITS ETF (GBP)0.65%20.88%MSCI CHINA A ONSHORE Net Return Index USDXtrackers Harvest CSI300 UCITS ETF (GBP)TER: 0.65%19.22%CSI 300 Total Return Net IndexXtrackers Harvest CSI300 UCITS ETFTER: 0.65%23.81%CSI 300 Total Return Net IndexHSBC MSCI CHINA UCITS ETF0.60%14.02%MSCI China A Inclusion IndexHSBC MSCI CHINA UCITS ETF0.30%19.06%MSCI China A Inclusion IndexLyxor China Enterprise HSCEI UCITS ETF0.65%11.53%HSCEI Total Return IndexLyxor China Enterprise HSCEI UCITS ETF0.65%7.37%HSCEI Total Return IndexXtrackers FTSE China 50 UCITS ETFM'ment fee: 0.40%11.31%Top 50 largest and most liquid chinese stocksXtrackers FTSE China 50 UCITS ETFM'ment fee: 0.40%6.83%Top 50 largest and most liquid chinese stocksXtrackers MSCI China UCITS ETFTER: 0.65%9.86%MSCI China Total Return Net Daily USD IndexXtrackers MSCI China UCITS ETFTER: 0.65%14.03%MSCI China Total Return Net Daily USD IndexLyxor MSCI China UCITS ETF0.30%14.22%MSCI China Net Total Return USD IndexiShares China Large Cap UCITS ETF0.74%10.68%FTSE China 50 IndexHSBC MSCI CHINA UCITS ETF0.60%9.95%MSCI China IndexHSBC MSCI China A Inclusion UCITS ETF0.30%32.62%MSCI China Index
