In this article, we take a look at some of the largest passive US and global ESG and SRI ETFs with one or two additional ones included for variety. Although ESG investments tend to capture, or in the case of index-linked ETFs be biased towards, a set of criteria that measure desirable corporate practices, and SRI is more about reflecting very specific investor social values in their construction, when it comes to indices and ETFs that track them there is a lot of nuance and variety.
Additionally, there are many ETFs that appear to be tracking the same index but on closer inspection there appear to be many customisations applied to the index providers flagship versions including (1) extended constituent universes, (2) fossil fuels criteria, (3) ‘leaders’, ‘focus’, ‘select’ tweaked versions and (4) extra diversification rules.
Choosing what to analyse
US and global are two of the largest ESG and SRI categories. BlackRock is the largest issuer with State Street Global Advisors, DWS, Vanguard, Amundi and UBS all represented in the top 25 ranked by assets. MSCI appears to be the index provider of choice. S&P Dow Jones Indices has reasonabletraction with variations on the S&P 500 and FTSE Russell indices have traction with their ‘Choice’ family with Vanguard.
We will use indices for the analysis because they tend to have longer track records than the ETF products. Unfortunately, FTSE Russell’s index history is too short for inclusion so we have added an ESG index by STOXX into the analysis despite a low level of ETF assets tracking.
The following indices are included in the analysis representing a big cross-section of tracked assets:
US ESG and SRI Indices• MSCI USA Extended ESG Focus• MSCI USA SRI• S&P 500 ESG• S&P 500 Fossil Fuel Free
Reference Market Benchmarks• MSCI USA• S&P 500
Global ESG and SRI Indices• MSCI World ESG Screened• MSCI World SRI Select Reduced Fossil Fuel• STOXX Global ESG Leaders Reference Market Benchmark• MSCI World
Since the ESG and SRI indices have a high correlation with market beta benchmarks, the analyses is primarily focused on their differences relative to market benchmarks.
The business cycle and its influence on asset prices
The business cycle moves through stages in which it expands, contracts and recovers and these stages have an influence on asset prices. During the early stage of a recovery, stocks and commodity prices tend to rise and during a contraction, stock prices tend to weaken while bond prices strengthen.
The returns of equity sectors are also sensitive to the business cycle. Industrials and financials, for example, tend to strengthen during the early stages of a recovery while technology stocks begin to shine as the business cycle moves into expansion.
Finally, the business cycle has demonstrably impacted risk premia for factors such as size, value, momentum and quality. For example, value stocks have tended to do particularly well in periods of recovery and less well during contractions. These relationships, of course, do not always hold and vary across markets.
This article specifically looks at US and global ESG and SRI risk premia sensitivities to macroeconomic variables and the business cycle while comparing and constrasting some of the main indices tracked by the largest ESG and SRI ETFs.
Tracking error over rolling three year periods
SRI indices appear to have larger tracking error to their reference market benchmark than ESG indices (see Table 1). Notice how MSCI USA SRI has the largest tracking error in the chart below and it has been increasing recently.
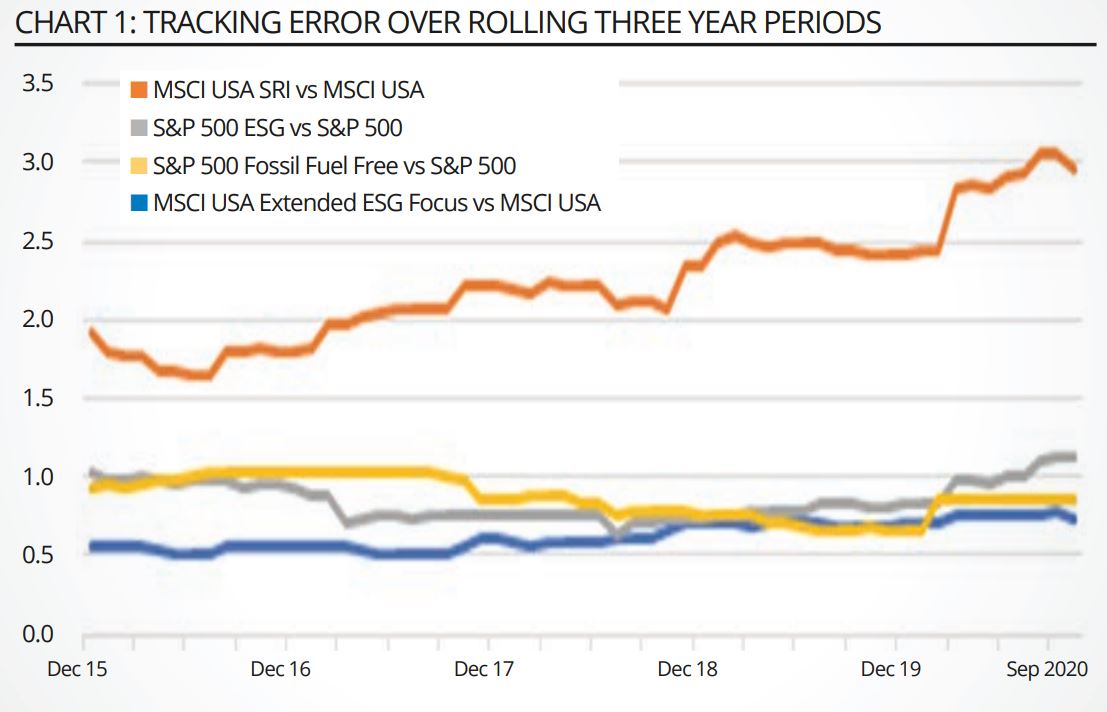
Source: Parala Capital
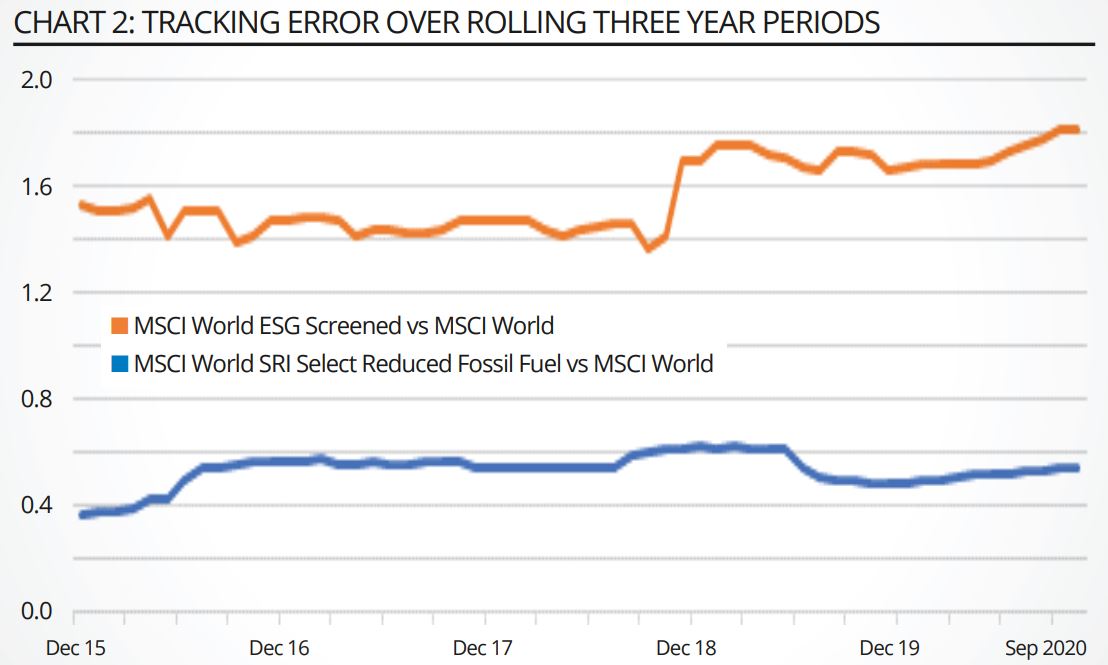
The same holds true for global SRI indices compared to ESG indices where we can see that MSCI World SRI Select Reduced Fossil Fuel has an unambiguously higher tracking error to the MSCI World.
This is relatively intuitive as ESG tends to focus on ESG criteria from an investment value perspective while SRI is about ensuring the portfolio represents the values of the investor which may imply a greater number of sector and stock exclusions (see Table 2).
Source: Parala Capital
A look across US ESG and SRI factors
The table below shows the latest business cycle sensitivities for the selected US ESG and SRI indices, as at 31 October. The values can be thought of as the macroeconomic betas for these indices where we focus on their residual returns after accounting for market, size, value and momentum factors exposures. The most meaningful comparison is for each business cycle variable column.

Source: Parala Capital
Table 3 shows that the US ESG and SRI indices have different business cycle sensitivities and are a useful guide for how they may perform across different macroeconomic environments. As an example, if the default spread were to widen due to a credit crisis or general deterioration in economic conditions then MSCI USA SRI may perform worst (all else being equal) because it has the largest negative sensitivity to the default spread.
On the other hand, the S&P 500 Fossil Fuel Free has the least negative sensitivity to default spread sensitivity and may perform better than other US ESG and SRI indices. As another example, we are currently seeing the term spread widen. If this trend were to continue, MSCI USA Extended ESG focus is best positioned (all else being equal) because it has the lowest negative sensitivity to the term spread.
Lastly, if we experience an increasing dividend yield then the S&P 500 ESG may be expected to perform better than S&P 500 Fossil Fuel Free because the former has a positive sensitivity to the dividend yield whereas the latter has a negative sensitivity.
A look across global ESG and SRI factors
Continuing the same analysis, the table below shows the latest business cycle sensitivities for theselected global ESG and SRI indices, as at 31 October 2020. The STOXX Global ESG Leaders index has the largest sensitivities across the macroeconomic variables because the index has a larger tracking error to the reference market index, which means its residual returns are larger.
You can see that MSCI World ESG Screened and MSCI World SRI Select Reduced Fossil Fuel often have sensitivities opposite of each other which indicates they are likely to behave somewhat differently across the business cycle. MSCI World SRI Select Reduced Fossil Fuel has the largest negative sensitivity to the short rate followed by MSCI World ESG Screened while STOXX Global ESG Leaders has a strong positive sensitivity to the short rate.
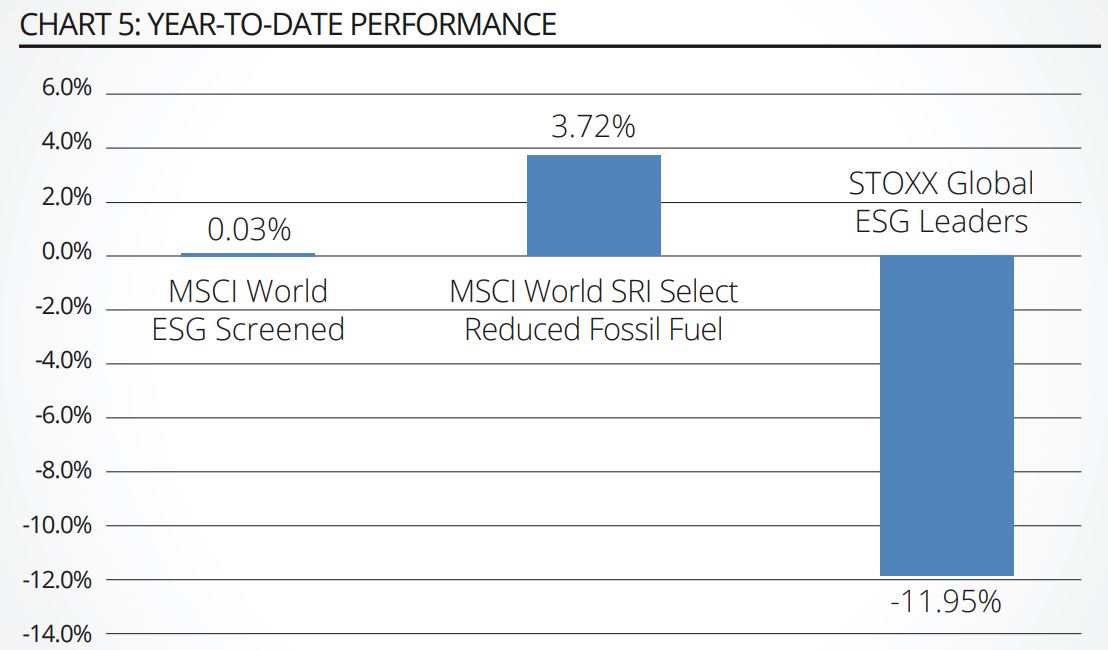
All else being equal, during periods of falling interest rates like we have experienced this year, MSCI World SRI Select Reduced Fossil Fuel may be expected to deliver the best performance among these indices and the STOXX Global ESG Leaders the lowest performance. This was indeed the case and is shown in Table 4.

Source: Parala Capital
Year-to-date performance
Different macroeconomic sensitivities may lead to different investment performance (see Table 5).
Source: Parala Capital
Active and passive investments have different sensitivities to the business cycle and these sensitivities change over time.
Additionally, the same factors constructed by different providers may impact investment behaviour across the business cycle and it is useful to have a framework (or system) to evaluate factor exposures and macroeconomic sensitivities of prospective investments and potential portfolio combinations of various investments.
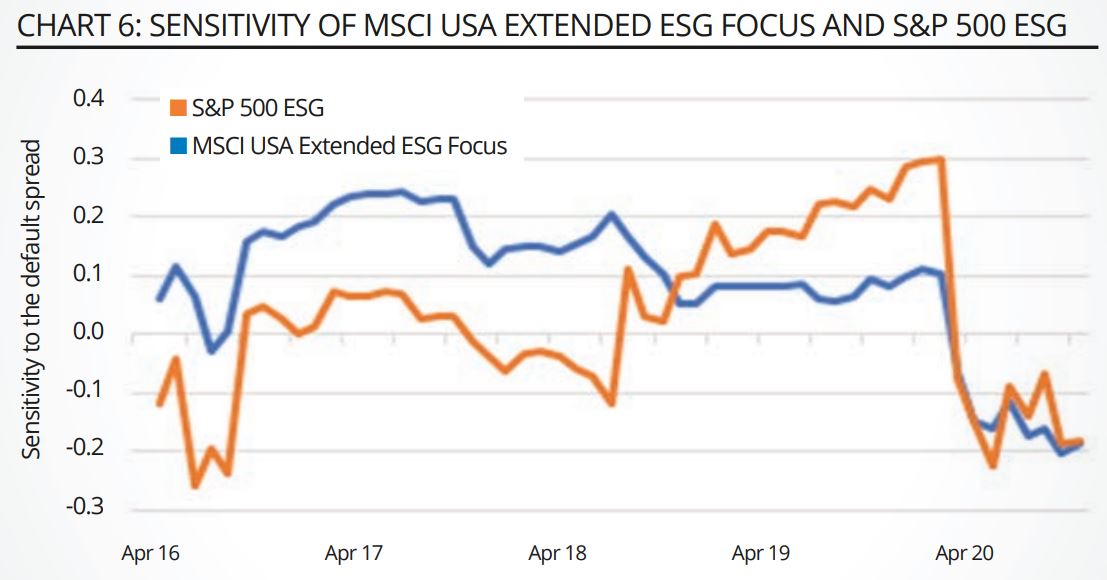
Below we show two US ESG indices, which are tracked by several large ETFs, and their changing sensitivities to the default spread
Changing sensitivity of MSCI USA Extended ESG Focs and S&P 500 ESG to the default spread
Table 6 shows how the sensitivity of these two indices to the default spread has changed over time. During the earlier part of 2016, we can see that MSCI USA Extended ESG Focus had a positive sensitivity to the default spread which continued to February 2020 whereas S&P 500 ESG had a negative sensitivity until November 2018 before turning positive.
Source: Parala Capital
Notice how both indices sensitivity to the default spread turns negative in April 2020 around the time of the economic shock caused by the pandemic and lockdown.
It is around this point that the Fed stepped in to provide stimulus, lowering interest rates as well as providing credit and acting as a buyer of last resort which put a cap on the spike in credit spreads. Both indices have a negative sensitivity to the default spread, as at October this year.
Steven Goldinismanaging partner and co-CIO at Parala Capital
This article first appeared in the Q4 2020 edition of Beyond Beta, the world’s only factor investing publication. To receive a full copy,click here.

