Last week’s highly anticipated Federal Open Market Committee meeting did little to settle the vigorous debate about inflation and interest rates.
The Federal Reserve, as expected, kept its benchmark overnight rate close to zero, and hinted it could begin preparations to taper its bond buying program in the not-too-distant future. But the central bank largely maintained its position that the recent spike in inflation will be a transitory phenomenon.
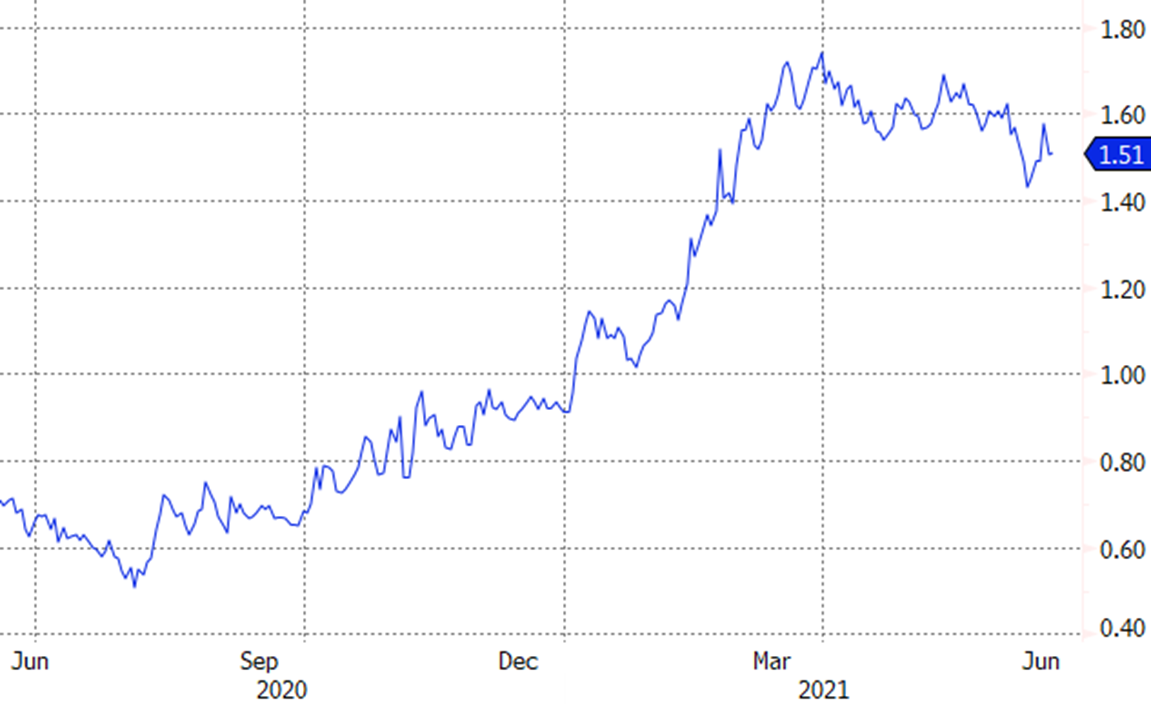
The initial reaction to the Fed’s announcement – a surge in the 10-year and 30-year Treasury yield bond yields – swiftly reversed itself the next day. The market just cannot make up its mind about inflation and interest rates.
10-Year Treasury bond yield
Fastest inflation rate in decades
At the heart of the debate is whether inflation in the US will continue to run well ahead of the Fed’s 2% target.
The latest Consumer Price Index (CPI) showed that prices for goods and services surged 5% year-on-year in May, the fastest pace of growth since 2008. The less volatile core CPI, which strips out food and energy prices, jumped by 3.8% in the month, the fastest rate since 1992.
Core CPI (YoY growth)
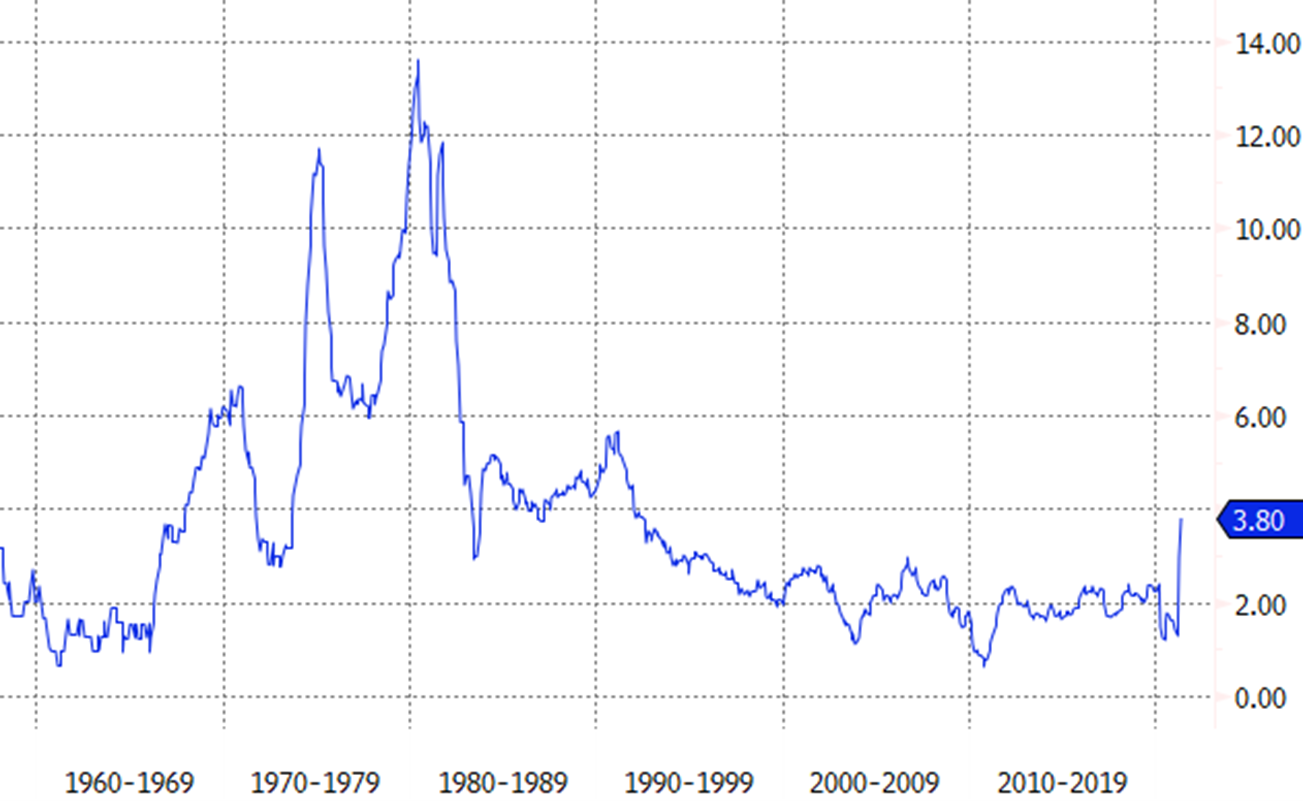
Whichever measure you look at, inflation is currently much higher than the Fed’s target.
For some investors, that is a problem. They believe that in the context of a booming economy and rapidly rising prices, the central bank should be tightening monetary policy, nipping inflation in the bud.
In their view, the Fed is being far too accommodative, which will result in inflation staying elevated and drive interest rates much higher from here.
Transitory phenomenon?
Proponents of the other side of the debate – which the Fed subscribes to – argue that high inflation is merely transitory, the consequence of massive one-off economic stimulus, a post-pandemic reopening of the economy, and base effects (unusually low inflation last year).
With regard to the latter, the core CPI only increased by 1.2% year-over-year last May, during the height of pandemic-related lockdown measures. Comparing prices this year to last year’s depressed levels makes inflation seem hotter than it would be under more normal circumstances.
Additionally, the $5trn of fiscal stimulus unleashed due to COVID-19 – including hundreds of billions of dollars’ worth of direct cash payments to taxpayers – is obviously not something that will be repeated on an ongoing basis.
Likewise, the immediate post-pandemic period, when a colossal amount of pent-up demand is released all at once, is a one-time thing.
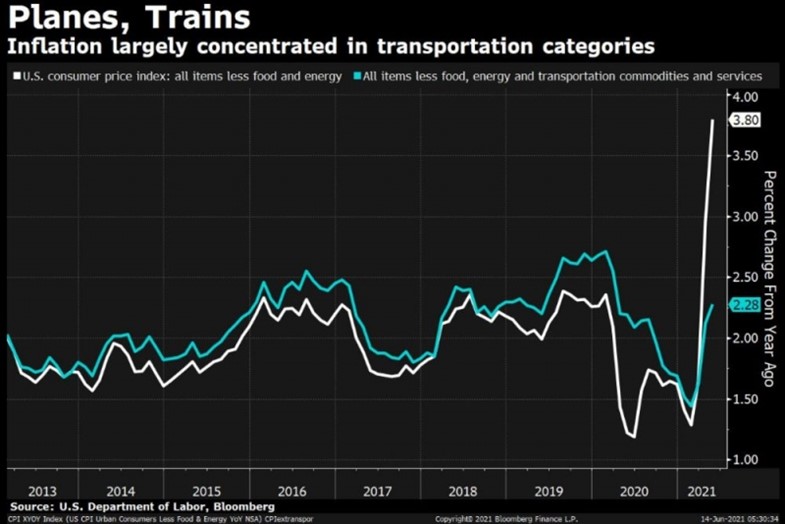
Illustrating the point, the Bureau of Labor Statistics noted that one-third of the increase in inflation during May was due to a stunning 29.7% year-over-year increase in used car prices. Airline fares, another category that was weighed down last year due to lockdown measures, surged 24.1% year-over-year last month.
A chart from Bloomberg’s Matthew Boesler shows that excluding the price spikes in transportation-related categories, inflation is at a much more normal level.
Impact on bonds
All of this is not to say that there is no risk of sustained, high inflation. Inflation is always a risk, and if it were to persist at a high level, would have significant repercussions for asset prices, including stocks and bonds.
Nowhere would that risk manifest itself more clearly than in the bond market. Bond investors are hypersensitive to vagaries in the inflation rate, as inflation matters dearly to what “real” (inflation-adjusted) return those investors receive.
Higher-than-expected inflation could spark a sell-off in bonds, particularly in bonds with longer maturities that are more sensitive to changes in interest rates (bond prices and yields move inversely). The iShares $ Treasury Bond 20+yr UCITS ETF (IDTL) has dropped 8.4% so far this year, as at 22 June, as long-term rates climbed off their record lows of 2020.
The iShares $ Treasury Bond 7-10yr UCITS ETF (IBTM), which hews closely to the all-important 10-year Treasury bond, has fallen 3.4% on a year-to-date basis.
If inflation surprises to the upside, these ETFs will likely take a hit. Conversely, they could also rally if the long-term disinflationary trend that was evident prepandemic reasserts itself.
Credit spreads and corporate bonds
Corporate bond ETFs, like the iShares $ Corp Bond UCITS ETF (LQDE) and the iShares $ High Yield Corp Bond UCITS ETF (IHYU) face a somewhat different dynamic than Treasuries. Interest rates matter for them, of course, but so do credit spreads – or the additional yield that investors demand for taking on credit risk.
As the economy has boomed and corporations find themselves flush with cash, credit spreads have narrowed to all-time-low levels, offsetting some of the negative pressure from rising rates. LQDE is down 2.8% on a year-to-date basis, but IHYU has risen by 2.5%.
Earlier this week, Bloomberg reported that junk bond yields, as measured by the Bloomberg Barclays US Corporate High Yield index, dropped to a record-low 3.84%.
Growth stock/interest rate link
While bonds are the asset class most directly impacted by fluctuations in inflation and interest rates, stocks are by no means immune. For much of this year, prices for growth stocks have ebbed and flowed based on changes in the 10-year Treasury bond yield.
Changes in interest rates affect the present value of future profits and cash flows, and that phenomenon tends to have a disproportionate impact on stocks of high-growth companies that are expected to generate the majority of their earnings in future years.
This link between interest rates and theoretical stock valuation is not always apparent in market prices, especially since there are many factors that drive stocks on a day-to-day basis. This year, though, the correlation between rates and growth stocks has been notably strong.
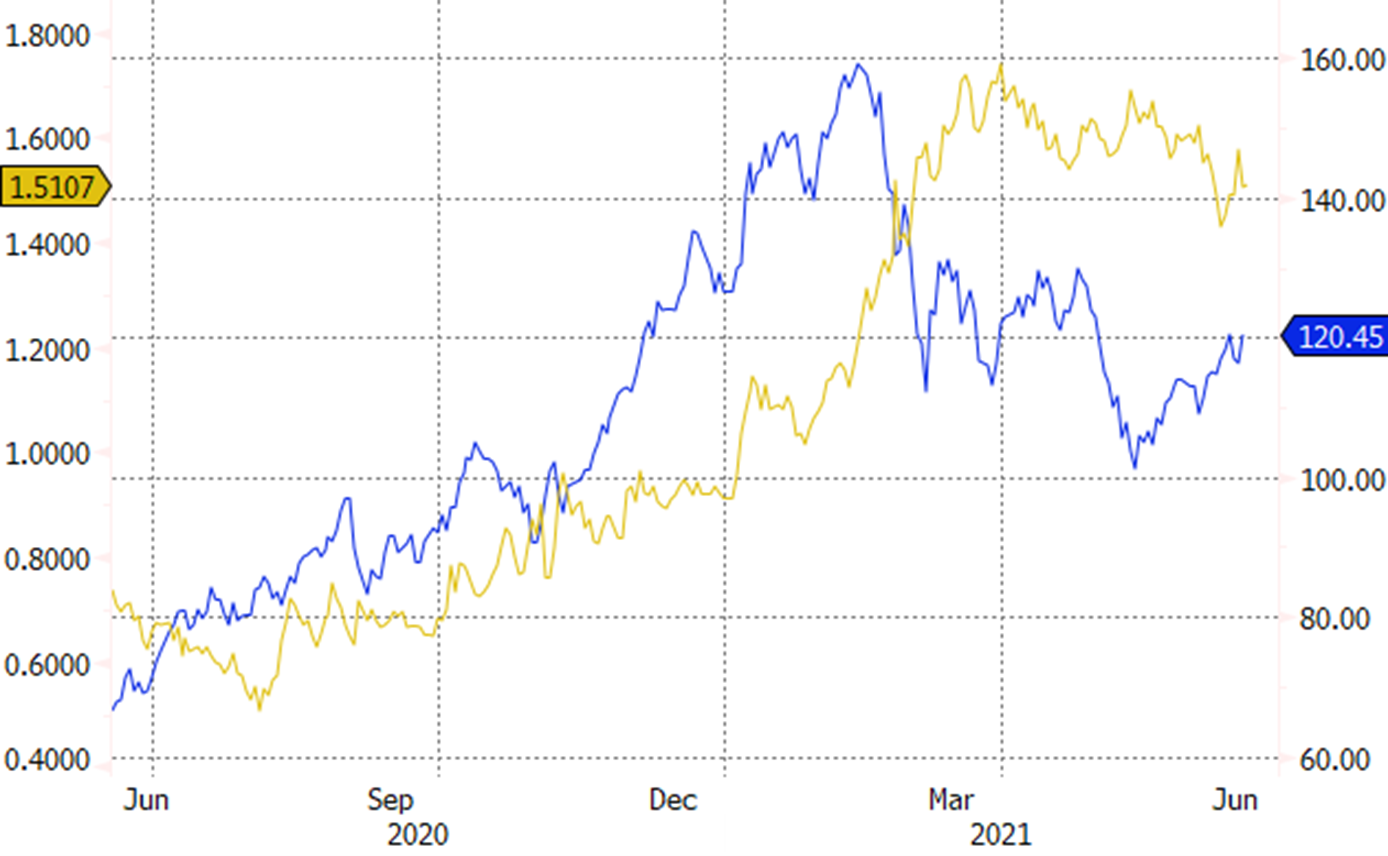
The ARK Innovation ETF (ARKK) took a big hit between February and May as the 10-year Treasury yield reached its recent peak around 1.75%, and it’s since rebounded as the 10-year yield retreated back to around 1.5%.
Yet, as you will notice from the chart below, ARKK and the 10-year yield both rallied together last year, reinforcing the idea that the interest rate/growth stock relationship is by no means set in stone.
ARKK (blue) vs 10-Year Treasury yield (yellow)
Still, most investors would agree that, all else equal, lower rates are better for all stocks, both from a valuation standpoint and a debt financing standpoint. Any sudden change in the inflation outlook, and thus the interest rate outlook, is bound to have ripple effects across the stock market – at least in the short term.
Debate rages on
With the Fed potentially set to begin unwinding its massive stimulus programs in the coming months, all eyes will be on the inflation data. The trajectory for consumer prices will have ramifications for how quickly or slowly the central bank tightens its monetary spigots, shifting interest rates in the process.
Just the hint of the Fed tapering its bond purchases in the coming months was enough to push rates all over the place this week.
The 30-year Treasury bond yield – which is sensitive to inflation expectations – tumbled to a four-month low below 2.1%, while the two-year Treasury yield – which is driven more by the Fed’s policy rate – jumped to 0.21%, its highest point in a year.
Actively managing duration, credit and inflation risk with ETFs
This flattening of the yield curve is a win of the “inflation is transitory” camp, though the inflation debate is far from over.
The inflationistas are still around, though the onus will be on them to show that after three decades of falling consumer prices, it really is different this time.
This story was originally published on ETF.com
