Gavin Smith, managing director and portfolio manager on the Quantitative Equity Team at QMA, examines the possibility of an unknown fundamental x-factor driving recent stock market returns.
Over the last 18 months, we have seen value strategies struggle. Prices have continued to pull further and further away from fundamentals. This has been particularly evident among speculative growth stocks. Prices for such stocks are now at extreme levels, as investors have become overly optimistic about their future growth potential.
A counterpoint is that speculative growth stocks are not actually expensive – they are priced correctly. In this argument, an unknown x-factor is responsible for driving the returns of speculative growth stocks.
Effectively, all fundamental valuation methodologies are flawed if they are not properly accounting for this x-factor (whatever it may be).
Perhaps this argument can be supported through the lens of what some call “weightless” firms, which are shifting away from physical capital investments to a capital-light model centred on investments in intangible assets, such as research and development, data, software, internet protocol, technology platforms and brand. Such intangibles are less likely to be fully reflected on the balance sheet. They are also somewhat less observable and harder to measure, yet critical to the success of a firm. Are such intangible assets examples of the unknown x-factor driving returns?
Testing for the x-factor
If intangible assets are, in fact, the x-factor responsible for pricing differences, we should be able to build valuation measures to capture them. One method is to integrate this presumed x-factor into valuations. Some academic studies have taken this approach. But we come at the problem from a different direction.
Since we are not sure what the x-factor really is, we would have to build all possible x-factors into our valuation model. Instead, we choose to evaluate the earnings growth an x-factor would be expected to deliver. Then we determine whether the results appear sensible. If earnings are expected to grow at unreasonable levels, it would be hard to justify the existence of an x-factor (or at least that the x-factor is motivated by fundamentals).
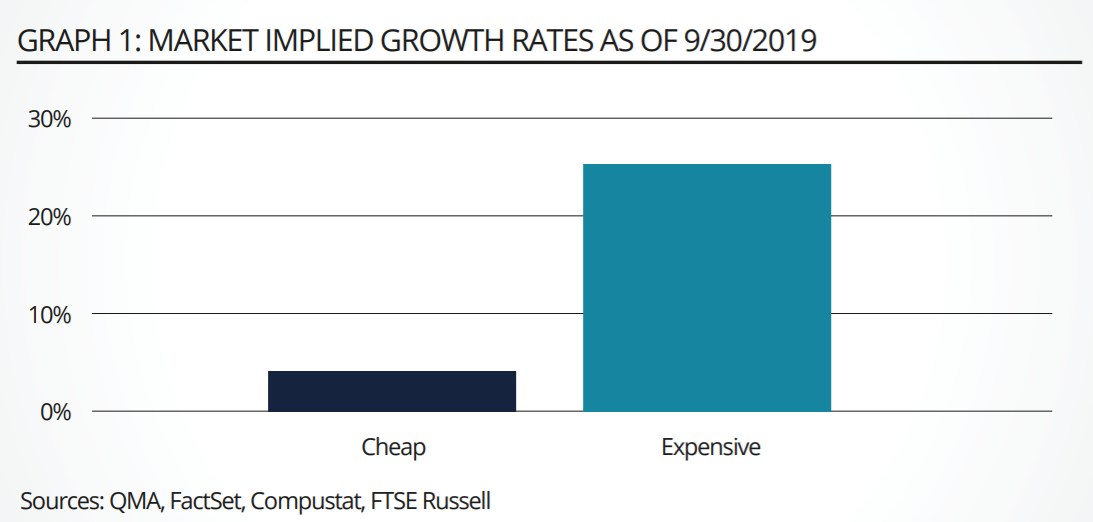
We utilise a discounted cash flow framework in our analysis. This assumes that the stock price accurately reflects its intrinsic value – basically, that the stock is priced right. We then specify earnings that grow at a constant rate (10 years, in our case) followed by a terminal value, all of which are discounted back to today’s values, using conservative firm specific discount rates. In this framework, we are solving for the market implied growth rate. We can then use the implied growth rate to examine the median growth rate for stocks we consider cheap and expensive (see graph 1).

Results
Our analysis shows that the median growth rate for expensive stocks is 25%. This means that median stocks would need to grow their earnings at 25% for ten years, in order to justify their current valuations. For instance, a company would be expected to grow $1 to $9.31 in 10 years’ time.
Frame this in terms of how much the median growth rate for expensive stocks exceeds GDP growth – and consider that the median firms are expected to deliver this rate of growth for 10 years. From an industry perspective: how could so many firms possibly grow at such extraordinary rates? Would not they compete against each other for market share? In contrast, the approximate implied growth rate for cheap stocks is a more reasonable 4%.
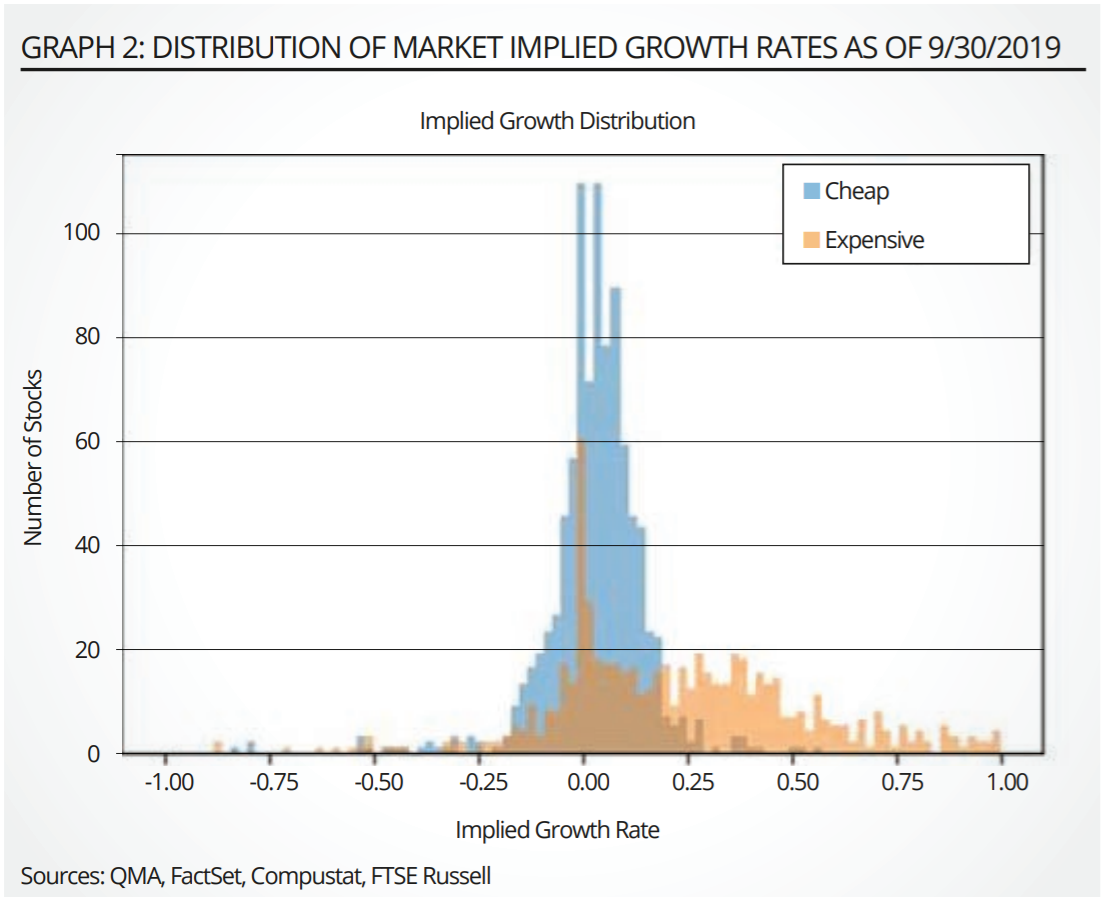
We believe that such a high implied growth rate for expensive stocks suggests that markets are reflecting overly optimistic expectations rather than some fundamental x-factor (see graph 2).

Historical Perspective
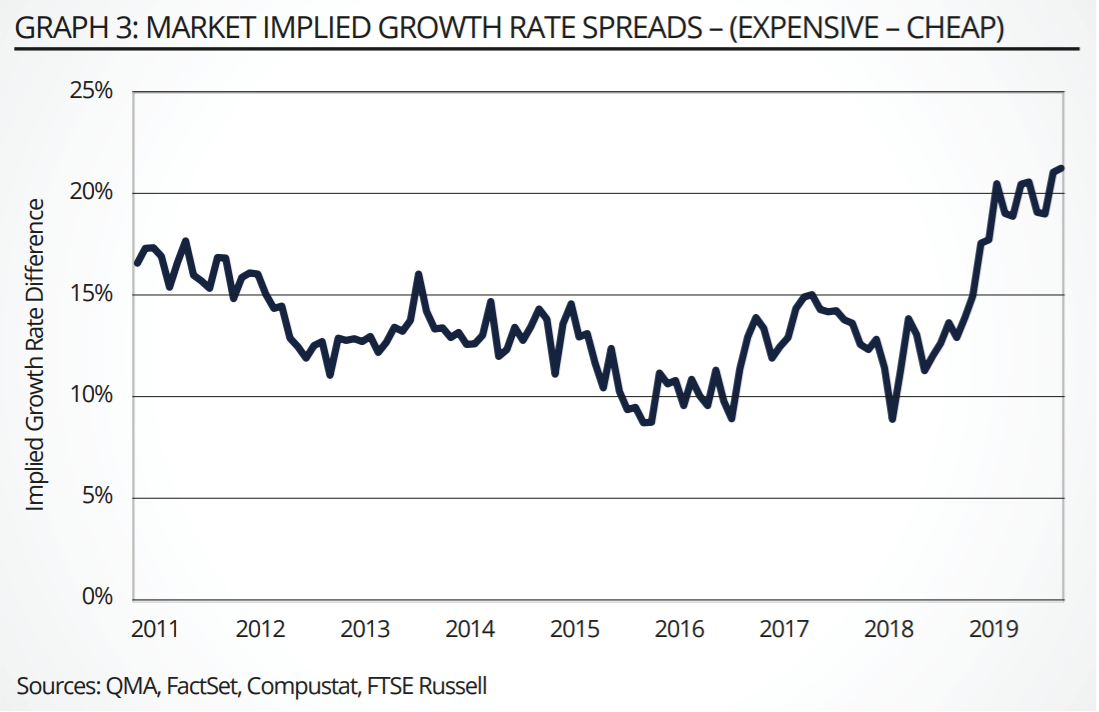
To help put the current implied growth rates into perspective, we examine the growth rates through time. We find that the current difference in implied growth rates between expensive and cheap stocks is at the highest level since the Global Financial Crisis (GFC). The difference in implied growth rates is beyond 20%. That is extraordinary. This difference is most extreme at a time when concerns about global economic growth is at its highest (compared to recent years). Clearly, something is amiss (see graph 3).

Actual vs implied growth rates
Maybe the implied growth rates are not as unusual as they appear. We look at realized growth rates to see if companies have actually delivered this level of growth in the past. Over the last five years, expensive firms have delivered earnings growth of 12%. This is half of what is currently implied by their prices. Cheap stocks, by contrast, have delivered earnings growth of 5%, modestly above their implied rates (see graph 4).
Interestingly, when we look at the distribution of growth rates, expensive stocks in the 75th percentile have delivered growth in the ballpark of 30%. So some firms do deliver growth close to what is currently implied. Remember though, that this is only at extreme levels, rather than the norm.
Conclusion
Our analysis shows that implied growth rates are at extreme levels, which median firms have not delivered throughout time. It is unlikely that prices and valuations are being driven by some fundamental x-factor.
We believe, rather, that prices are being driven largely by sentiment. Investor exuberance is driving price movements. Such a dislocation between prices and fundamentals can increase return potential for value investors. It can also set non-price conscious investors up for dramatic losses in the event of a sentiment crash.
Gavin Smith is managing director and portfolio manager on the Quantitative Equity Team at QMA
This article first appeared in the Q1 2020 edition of Beyond Beta, the world’s only smart beta publication. To receive a full copy, click here.


