Small-cap stocks have become a distinct asset class in the eyes of market participants and have received separate allocations away from large caps, according to research from S&P Dow Jones Indices (SPDJI).
Following the wider adoption of small caps, SPDJI wanted to test whether quality has earned a similar premium in international small cap benchmarks.
In its research, named Building Better International Small-Cap Benchmarks, SPDJI uses its S&P Global SmallCap Select Index series, which launched at the end of 2018, to test a number of profitability metrics such as positive earnings or high profitability ratios outperformed portfolios without said metrics.
Profitability test
A simple method to positively impact returns for an international small cap benchmark is to exclude unprofitable companies using earnings per share (EPS) as a measure of profitability.
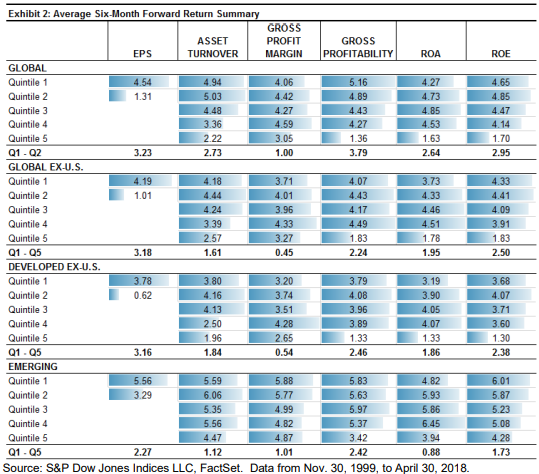
Other measures of profitability include asset turnover, gross profit margin, gross profitability, return on assets (ROA) and return on equity (ROE). SPDJI uses these six metrics to test and compare the average six month forward return across four regions: Global, global ex-US, developed ex-US and emerging markets. SPDJI also ordered the companies based on profitability and then grouped them into five quintiles before applying the metrics.

Unsurprisingly, the more profitable groups (quintile 1) generally had higher future returns than the lower ranked groups across all regions and metrics. The best way to capture this premium is to go long on quantile 1 while going short on quartile 5, or simply exclude the group.
As a result of the effectiveness of the positive earnings rule on returns, SPDJI launched its S&P SmallCap Select Index series incorporating a positive earning screen to capture this earning premium. The series uses the EPS metric to determine which companies to include and exclude from the indices.
S&P SmallCap Select Index series
Using the S&P Global BMI as the benchmark, which has an initial population of 8,332 securities, each SmallCap Select index typically covers 60-65% of the benchmark in terms of the number of constituents for its respective regions. However, the indices still manage to have a market cap coverage closer to 75-85% having removed the fifth quintile group which are the securities with the lowest market cap.
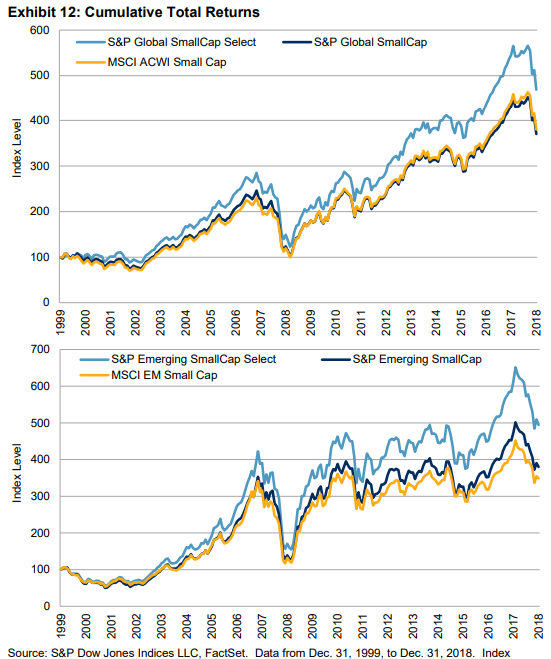
Historically, the performance of the SmallCap Select Index series has been positive having outperformed its benchmark across all regions, ranging from 0.9% to 1.6% per year. Comparing the S&P Global SmallCap Select index and S&P Emerging SmallCap index, its largest outperformer, with MSCI’s equivalent indices, we can see the significance of their performances.

The above graph shows to what extent the S&P Global SmallCap Select index and S&P Emerging SmallCap Select index outperform their benchmarks and MSCI counterpart.
SPDJI says international small caps is one area where active managers are thought to have an advantage in providing alpha over industry benchmarks. Most active strategies in the international small cap space likely incorporate some form of quality measure in their stock selection so it makes sense to use a benchmark that is similarly adjusted.
The number of active managers outperformed by the Developed ex US benchmark bodes well for passive enthusiasts. Even more active managers were outperformed by the SmallCap Select equivalent. Over one year, 65.5% of active managers were outperformed by the S&P Developed ex US SmallCap index and 73.6% were outperformed by the S&P Developed ex US SmallCap Select Index.


