Markets are recoiling again after Russia launched a full-scale invasion of neighbouring Ukraine on Thursday. The US government had been warning for weeks of the assault, but many people – including many investors – had held out hope for a diplomatic solution to the crisis.
Those hopes were quickly dashed as Russia unleashed missile strikes and troops into Ukraine overnight. Analysts said this is essentially the worst-case scenario in terms of the Ukraine-Russia crisis. No one knows exactly how things will unfold but there is speculation that Russian President Vladimir Putin will attempt to install a Kremlin-friendly government in Ukraine.
Western countries are expected to unveil harsh, sweeping sanctions on Russia in response to the country’s incursion into Ukraine – arguably the most significant attack on a country’s sovereignty since World War II.
While the exact list of sanctions that the US and its allies will apply to Russia remains to be seen, restrictions related to technology exports and financial markets are likely to be a part of any package. There is also the potential for Russian banks to be banned from using SWIFT, a key global payments system.
Russia ETFs collapse
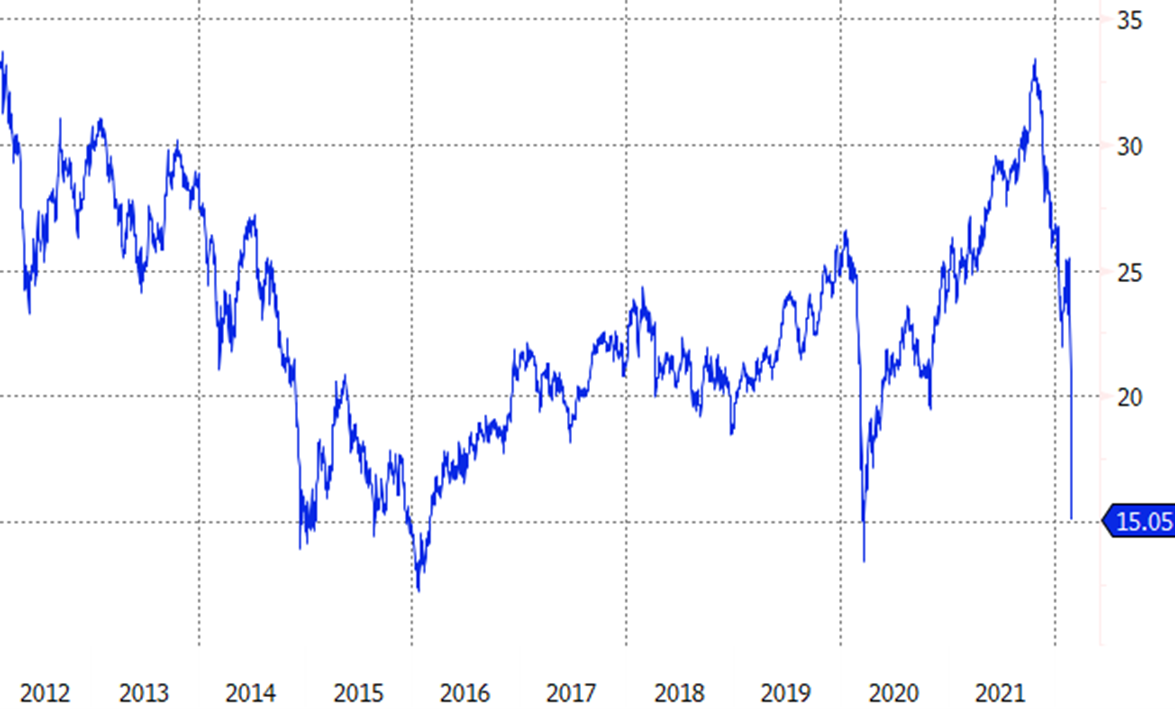
The prospect of these harsh sanctions led to intense selling in Russia ETFs today. The VanEck Russia ETF (RSX) tumbled a whopping 22% yesterday. That is on top of losses of 9.3% on Wednesday and 8.9% on Tuesday.
The ETF has been more than cut in half from its October highs and finds itself at the lowest levels since the depths of the pandemic-driven sell-off in March 2020. It is a similar story for the iShares MSCI Russia ETF (ERUS), which is down 19% on the session.
RSX

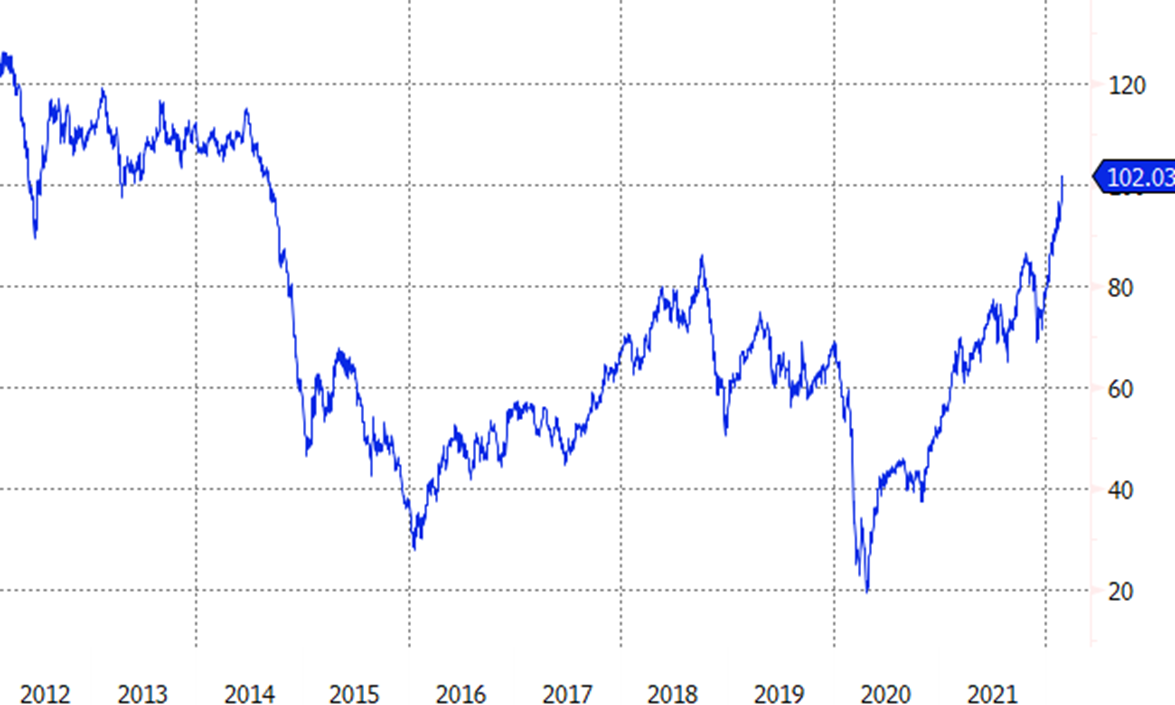
Spiking oil prices, which topped $105 a barrel for the first time since 2014, have done little to support Russia’s stock market – though things could have been worse for the market were it not for the surge in oil and gas (which together account for one-fifth of the country’s GDP, per the Wall Street Journal).
The United States Brent Oil Fund (BNO) is up 30.3% year-to-date, making it one of the top-performing ETFs in a dismal year for financial markets overall.
Brent Crude oil prices

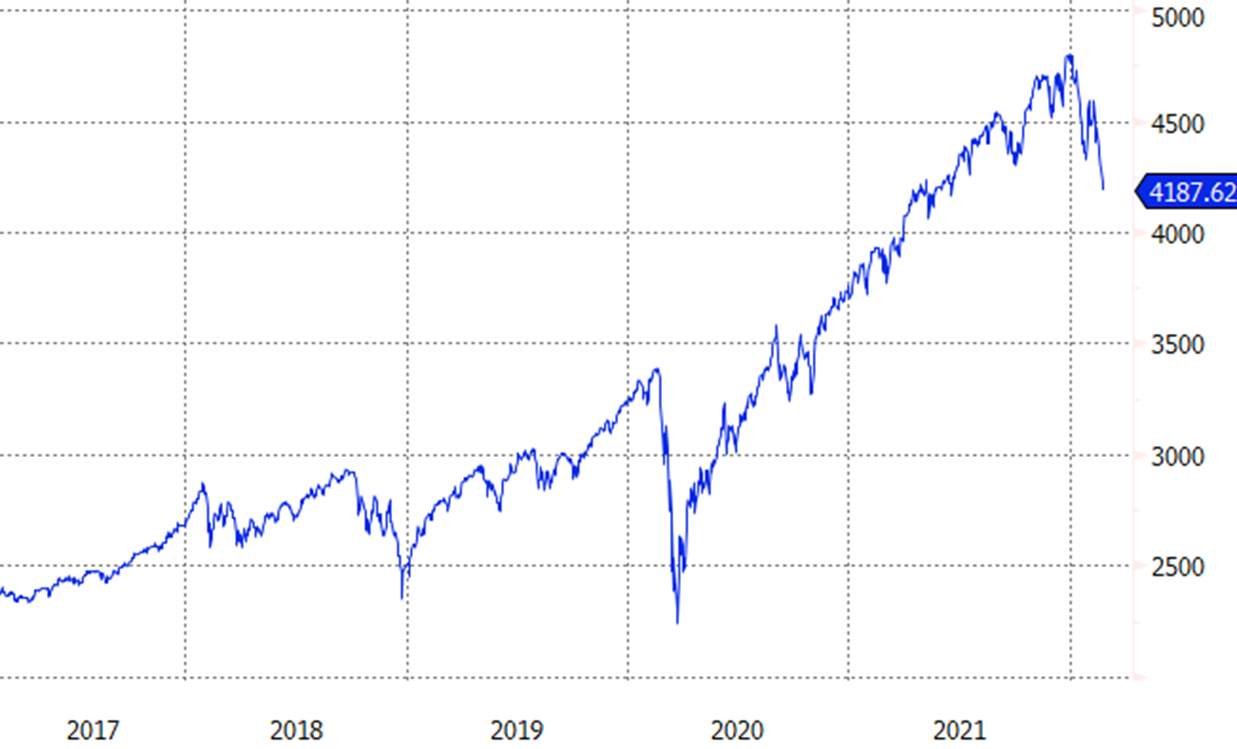
In stark contrast, the iShares Core S&P 500 UCITS ETF (CSPX) is now down 13% since the start of the year and 14% from its all-time high reached in early January. The underlying S&P 500 is now firmly in correction territory and investors are bracing to see whether it heads into a bear market, or 20% down from its highs.
S&P 500

This story was originally published onETF.com
Related articles


