Fragmentation across dozens of ETFs tracking the same index and several indices being offered per exposure call for a new way for investors to assess long-term holding costs, according to Sébastien Lemaire, head of ETF research at Société Générale.
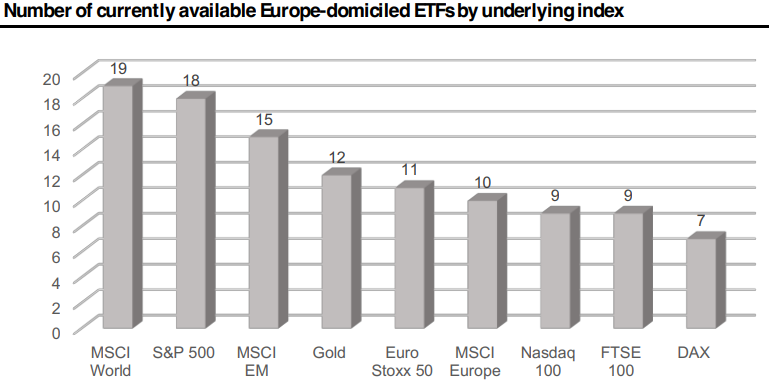
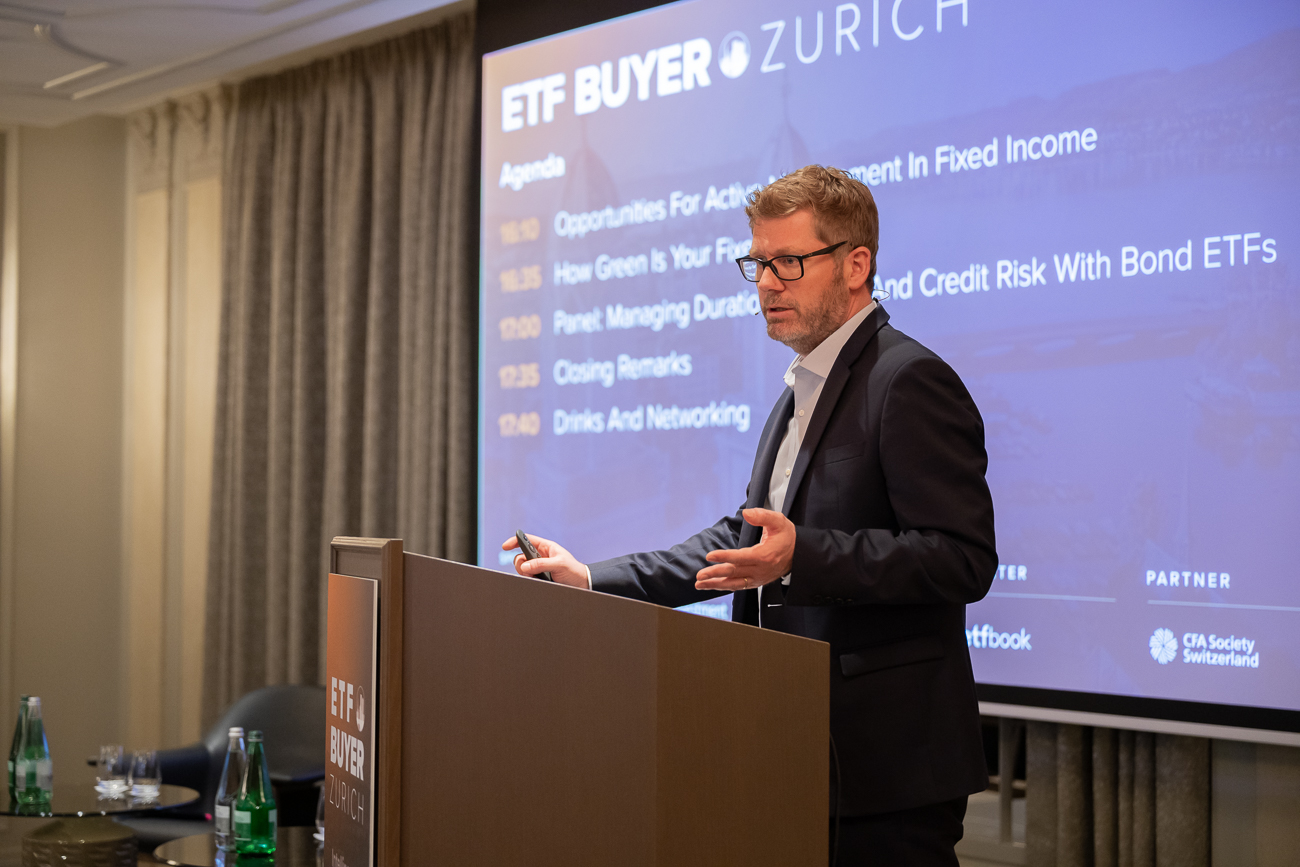
Speaking at ETF Stream’s ETF Buyer: Zurich 2024 event last week, Lemaire (pictured) argued the European ETF market remains highly fragmented, with almost 20 ETFs tracking each of the most popular equity indices.
Chart 1: Number of Europe-domiciled ETFs tracking each underlying index

Source: SG Cross Asset Research
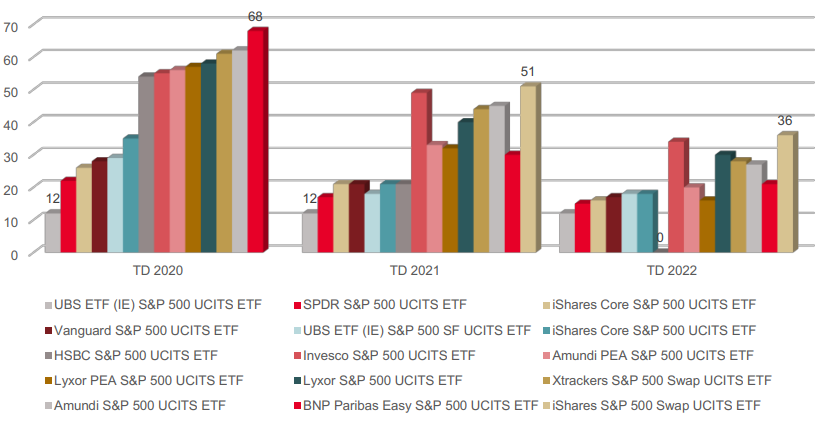
Within each of these exposures, he highlighted ETFs replicating the same benchmark rarely deliver the same returns, with deviations fluctuating over time.
Chart 2: S&P 500 UCITS ETFs’ annual tracking difference

Source: SG Cross Asset Research
The situation has only become more complex with the rise of non-vanilla equity exposures, which now comprise roughly a third all Europe-domiciled equity ETFs across 438 thematic and smart beta strategies by the end of 2023, up from 91 a decade earlier.
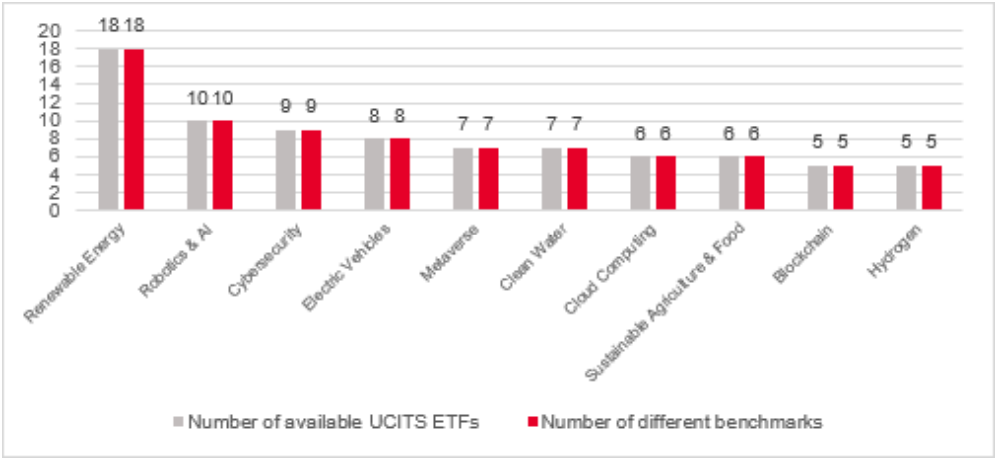
Not only do these strategies often delve into more granular and illiquid corners of the market than their broad, market cap-weighted predecessors but ETF issuers also look to differentiate by expressing thematic IP by tracking distinct indices.
Chart 3: As many thematic indices as there are ETFs

Source: SG Cross Asset Research
The upshot of these observations is a growing need for investors to look beyond traditional frameworks such as Sharpe ratios for assessing risk-adjusted returns, with the usefulness of this measure reduced by skewness, kurtosis and negative returns, Lemaire said.
Instead, SocGen’s own ETF ranking methodology relies on probabilistic Sharpe ratio (PSR) – measuring the probability that the Sharpe ratio beats a benchmark Sharpe ratio, after correcting for skew and kurtosis – when examining ETFs and their underlying strategies.
First, the methodology measures the risk-adjusted return of ETF underlying indices by using the PSR, over a one, three and five-year window. Next, SocGen measures the risk-adjusted return of ETFs relative to their underlying indices by adapting the PSR formula to calculate a probabilistic information ratio (PIR).
Finally, the methodology ranks ETFs by descending order of Sharpe ratio and then descending order of information ratio, with each ETF receiving a historical one, three and five-year ranking.
Lemaire said his team does not just rank on a long-term basis as 40% of UCITS ETFs have launched within the past five years.
He added passive ETFs are examined on PSR and PIR whereas active ETFs are only examined for PSR, given the goal of passive ETFs is to minimise tracking error, meaning they tend to have high information ratios.
Lemaire noted the SocGen ranking focuses on ETF holding costs rather than liquidity costs, given how much an ETF drifts from its underlying benchmark is the most important consideration for long-term investors.
“We wrote a report five years ago of the liquidity costs of ETFs on the secondary market – it is highly volatile, Lemaire continued.
“It is not really dependent on the ETF itself but the environment – the day you trade the ETF, the time of the day, the inventory of the market maker and the size of the trade.
“Over two years, the same size of order on the same share class, the bid-ask spread can be one or 20 basis points (bps).”


