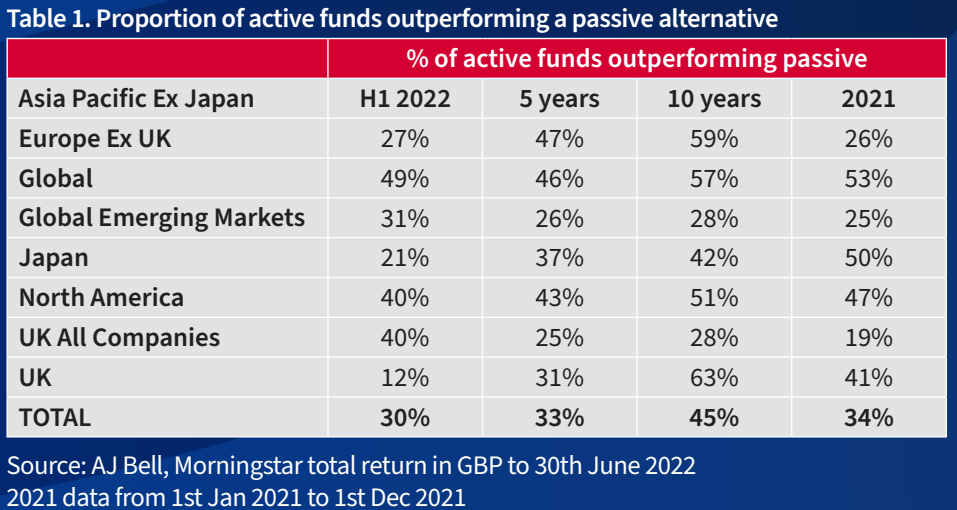
The argument that active management shines during periods of volatility has been dealt another blow with the share of active outperformance falling to less than 33% during the first half of the year, according to research conducted by AJ Bell.
The firm’s Manager versus Machine paper found just 30% of active equity funds outperformed passive alternatives in H1, down from 34% for the same period a year earlier.
A key trend in the first half was a reversal of the low interest rate, pro-large-cap growth regime that dominated the post-Global Financial Crisis (GFC) era.
Over the past decade, active managers were able to find joy in the more ‘old economy’-oriented UK market, with a bias to small caps being a key hunting ground for active manager alpha. In fact, 94% of UK active funds are underweight large caps versus the average passive fund, according to AJ Bell.
With small caps suffering in H1 and large-cap energy and defensive sectors in the ascendency, UK-focused active managers have faced a change in fortunes. Just 12% of UK active funds outperformed in H1 versus 41% over the same period last year.
Laith Khalaf, head of investment analysis at AJ Bell, said: “The longer-term performance figures show that carrying a higher exposure to the small and mid-cap areas of the market has been a significant boon for UK active managers, and acts as a key differentiator from index trackers.
“Looking forward we can therefore probably expect that to continue to be the case, albeit with some setbacks along the way.”
The opposite scenario played out in the US, however, where the strongest performers have typically been in the well-covered large-cap growth segment, which also happens to dominate the benchmarks tracked by passive funds.
Amid a tech sell-off, the portion of US-focused managers outperforming passives more than doubled from 19% to 40% between the first half of last year and this year.
Crucially, 76% of the pack that outperformed in H1 are underweight tech. Interestingly, though, the average tech allocation of US active funds is just half a percent less than that of the average passive fund, which probably goes some way to explaining why outperforming managers remain in the minority.
Taking a broader view of the active landscape, including global, emerging markets, Japan and Europe exposures, the picture becomes more optimistic with 45% of the total cohort outperforming passive alternatives over the past decade.

However, Khalaf noted: “That is less than half of course, and will be flattered by survivorship bias, as unsuccessful funds will tend to wind down or be merged into others.”
This fact was well-evidenced by S&P Dow Jones Indices’ SPIVA Europe scorecard at the start of the year, which found only around half of the 1419 global equity funds, 426 US equity funds and 1178 Europe equity funds listed in the continent survived the 10-year period to the end of 2021.
To be clear, passive funds also closed in this period, but older-serving, vanilla ETFs tracking broad market indices have been among the most popular products and closures come nowhere near half the range that existed in 2011.
Another damning feature of AJ Bell’s report was a reflection on the disparities between average active and passive fund charges.
On UK All Companies, which is among the most densely populated exposures by active managers, the disparity in fees between the average active and passive fund is 0.68% which is the smallest gap out of all the exposures AJ Bell examined.
In other areas, such as global emerging markets, the difference was as great as 0.81%.

Assuming an average pensioner might have a retirement account of half a million pounds, over 10 years at a market return of 6% per year that 0.81% fee difference could cost them around £65,000 in lost returns, according to calculations from ETF Stream.
Of course, the active versus passive fee debate is not a new one and although passives tend to have lower average fees than their equivalents, they are not without faults.
AJ Bell underlines this by showing the cheapest UK All Companies passive product charges a fee of just 0.05% while the most expensive in class charges 1.06%.
“There is simply no reason for investors to hold expensive trackers when they can buy a fund that does the same job at a fraction of the annual cost, which just means more money in their pocket at the end of the day,” AJ Bell’s Khalaf argued.
Unfortunately, such products are still marketed to UK consumers by banks such as Halifax and Lloyds.
In February, ETF Stream reported the Halifax UK FTSE 100 Index Tracking Fund C and Formerly Lloyds TSB FTSE 100 Tracker Pension Fund operate with fees of 1.07% and 1%, respectively. The latter also carries a bid-ask spread of 5%.
Hopefully, investors will continue pressuring asset managers to keep reducing fees over time. For now, passive funds on average offer cheaper and better-performing solutions, though it is worth remembering pockets of active outperformance remain.
Related articles


