Many market pundits are keen to call time of death on the bear market after the 60/40 portfolio just booked its worst annual performance in 84 years. The trouble is, four-decade highs in inflation and interest rate hikes could mean the modern investing playbook and the signals used for calling a market bottom are in need of revision.
With the US consumer price index (CPI) freefalling from 9.1% to 6.5% between July and December last year and the Federal Reserve slowing its Fed funds rate hikes to 50 basis points (bps) in December, there were already signs of a cooling economy or the early knockings of a recession – which could mark a cycle low point for equity prices.
Supporting this, David Henry, investment manager at Quilter Cheviot, said the current drawdown has already been the longest since the 2008 Global Financial Crisis (GFC), with 280 days between the start of 2022 and the MSCI World index’s recent lows in October.
This is not far off the 315-day average for bear markets dating back to 1973. Unfortunately, while markets have turned ‘risk-on’ in recent months, signs of further economic pain ahead appear to be mounting, with 154,000 US tech sector lay-offs in under three months and expectations of weakened earnings going forward.
However, questions remain over what some have called ‘the most telegraphed recession’, such as when, or if, it will crystallise at all.
Henry said it is “very difficult to be bullish” on the economy and although stocks “have been doing a lot of heavy lifting” to price in potential difficulties, he expects the UK and Europe to enter a recession while the S&P 500 “could find new lows” regardless of whether the US avoids a deep recession.
John Leiper, CIO of Titan Asset Management, noted a “general trend towards the negative side” on corporate earnings guidance.
“Our outlook is a continuation of the decline in risk assets, probably through the first half of this year as the US Federal Reserve and other central banks maintain their conviction in keeping rates higher for longer.
“As things stand today, the futures would bring the index back down below the resistance level that was in place all of last year – and we had at least six or seven bounces from that.”
Michael Cembalest, chairman of market and investment strategy at JP Morgan Asset Management, agreed with a bleak economic outlook, saying: “Leading indicators suggest that a major growth slowdown is coming to the US and Europe.
“Whether a recession technically occurs or not is beside the point; for equity investors, the slowdown ahead is likely to drag corporate profits down with it.”
However, he argued equities may not find new lows: “If history is any guide, the equity bottom would also coincide with the end of Fed hikes. I expect equity markets to bottom sometime in the first half of next year and for the October 2022 lows to hold.”
Taking an even more optimistic stance was Christopher Dembik, head of macro analysis at Saxo Bank, who said macro factors such as softening energy prices and resilient ‘hard data’ are prompting banks such as Goldman Sachs to upgrade their eurozone GDP growth forecasts, up to 0.6% from -0.1% previously.
“The underlying equity trend is now bullish,” Dembik argued. “I have noticed in recent sessions a strong rise in the volume of trades and a sharp increase of volatility for small and medium companies listed in Europe.”
Does the perfect depth finder exist?
As for how investors and analysts search for market bottoms, their methods vary almost as much as their economic outlooks.
Titan AM’s Leiper said his firm uses technical indicators based on historical trends to determine S&P 500 resistance levels in different scenarios, such as 4000 points, 3600 points and 3000 points in bull, ‘muddle through’ and bear cases, respectfully.
“It is not fool proof but it does give us a good indication,” Leiper said. “We do not want to catch a falling knife, so to speak, so we would like to see prices stabilise and investors deploy some of the ‘dry powder’ they have on the sidelines, even if this means missing out on the first few points of gain in a more substantive recovery.”
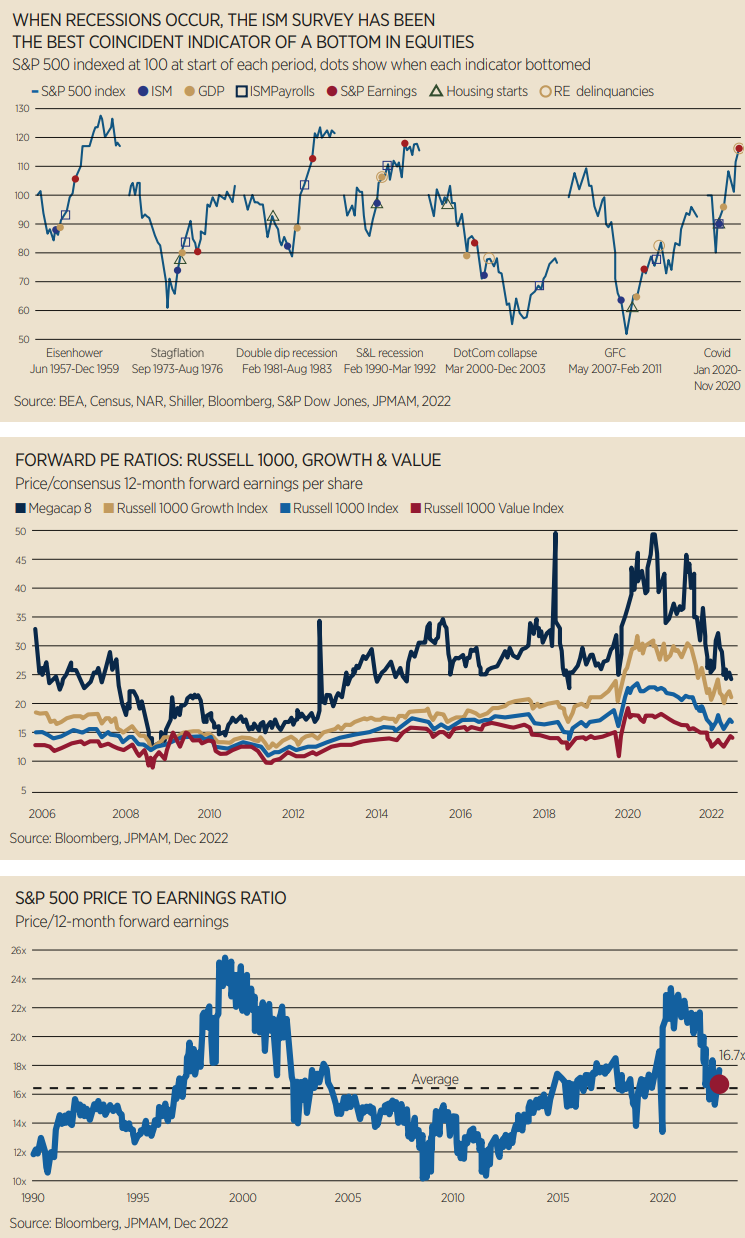
For JPMAM’s Cembalest, recession is king when it comes to calling the market bottom – and the ISM manufacturing survey, or manufacturing purchasing managers’ index, is his preferred indicator for spotting a recession.
“In the history of US recessions – with the exception of the dot-com collapse of 2001 – equity markets bottomed well before the bottom in GDP, payrolls, S&P 500 earnings and housing starts and the peak in household and corporate delinquencies.
“The ISM survey has been the most reliable coincident indicator of a bottom in equities, which is why we pay so much attention to it.”

Quilter’s Henry agreed recession is a key indicator, given the “US market has never bottomed before a recession” in recent history.
However, his method for spotting recessions considers a number of variables, “as almost every single metric stops working at some point”.
Looking at MSCI World, he said its price-earnings ratio of 14.0 was near the historical average and it will be key to see how movements in the US dollar impact earnings. A softer dollar would support US companies operating internationally, which is key given US equities make up 63% of MSCI’s World index.
He continued, saying inflation may have started to crack, but wages are still growing and lay-offs remain below forecast, which is significant as “employment tends to be the last thing to go – it is easier to slow hiring than tell employees they are being let go.”
Finally, he argued a metric that does work is the yield curve inverting, which is eight for eight in predicting recessions since the late 1960s. However, economist Campbell Harvey – who first noticed this pattern – recently told Bloomberg this may be the first time his indicator is “flashing a false signal”.
“Humility is very important in this environment,” Henry concluded. “The question is to what extent are all these factors priced-in? No-one can tell you that and anyone who says they can is a charlatan.”
This article first appeared in ETF Insider, ETF Stream's monthly ETF magazine for professional investors in Europe. To access the full issue, click here.
Related articles


