HSBC Asset Management debuted Europe’s first ETF targeting the growth story of India’s tech sector this week, however, its underlying index back-test suggests the investment strategy has struggled to differentiate from the country’s broad equity market in recent years.
The HSBC S&P India Tech UCITS ETF (HITC) listed on the London Stock Exchange, Euronext Italia and Deutsche Boerse with a total expense ratio (TER) of 0.65%.
HITC’s arrival follows India's tech sector revenue surpassing $200bn in 2022, a 15.8% increase on the year before, with a forecast exceeding $500bn by 2030, according to a report by India’s software trade association, NASSCOM.
It also coincides with India’s relative rise because of the ‘China-plus-one’ approach to supply chains and asset allocation by western investors, which has seen the rift between China and India’s weightings in the MSCI Emerging Market index decrease to its narrowest level since the flagship index’s launch.
Looking to offer a tool to capture these trends, HITC tracks the S&P India Tech index of Indian companies involved in communications, digital tech or software-related activities.
The benchmark applies FactSet’s Revere Business Industry Classification System (RBICs), offering a revenue-based lens on companies’ tech exposure, requiring new and existing constituents to have 90% and 80% revenue exposure, respectively, to target subsectors.
Companies must also have a float-adjusted market cap of $300m and six-month median daily value traded (MDVT) of $1m to be eligible for inclusion.
In the field
In practice, this strategy takes the form of a 38-constituent basket, awarding 70.1% of its allocation to the information technology sector and 23.5% to communications.
This is comprised of four double-digit weightings to single stocks including 14.2% to Infosys. While constituents are capped at 15% at each semi-annual rebalance to avoid overconcentration, HITC’s benchmark allocates a considerable 72.3% to is top 10 constituents.
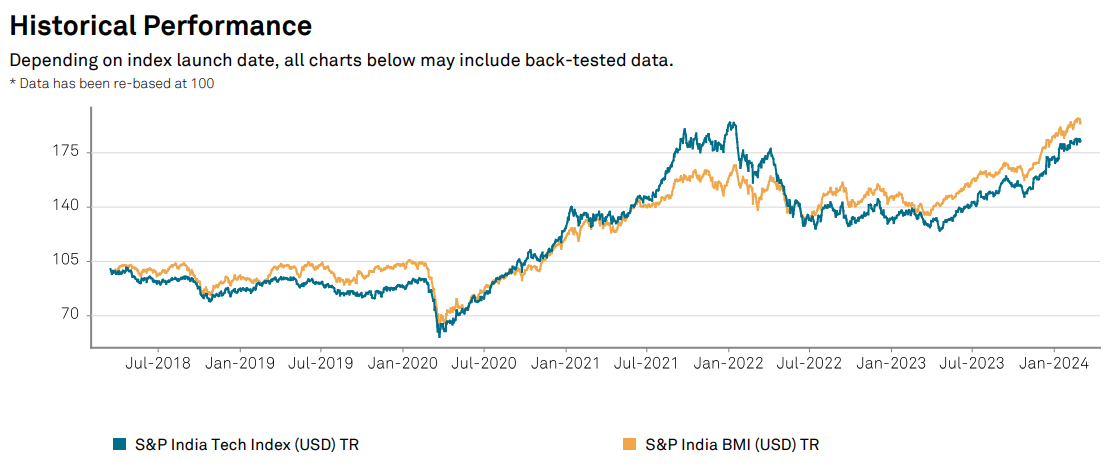
Interestingly, despite the tech benchmark having a far narrower remit than the broad market, 834-constituent S&P India BMI index – and the two only sharing three of the same top 10 constituents – both have been highly correlated since the former started being valued in March 2018, with the whole-market index currently leading on performance at the time of writing.
Chart 1: Historical performance of India tech vs India BMI indices

Source: SPDJI
While this may be reflective of the current maturity of India’s tech sector rather than any shortfall in index construction, investors may be wary of taking more concentrated single sector bets which have previously been unrewarded - especially when broad India ETFs have TERs starting at 0.19%.
The merits of India tech
Alberto Garcia Fuentes, head of asset allocation at ACCI Capital Investments, told ETF Stream: “It is normal the tech sector displays higher beta. If tech companies in India grow, their market-cap will increase and the correlation will be even higher.”
However, along with many investors, he has become accustomed to the stratospheric returns offered by the tech sectors of other countries such as the US.
“What I miss from my side is a comparative with the US ‘magnificent seven’ mainly in terms of growth, which will affect valuation on a price-to-earnings basis,” he added.
Even zooming out from the high-flying group of seven, the S&P 500 Information Technology index has far outstripped the S&P 500 in recent years, returning 300.2% versus 182.1% over five years, as at 4 March, according to data from S&P Dow Jones Indices.
“The question is why invest in India when in the US I have companies with huge cash flow? The possible answer might be growth perspective and cheaper valuation,” Garica Fuentes concluded.
This perspective might frame HITC not as an ETF targeting what should already be a winning sector but something closer to a fund selector’s valuation-conscious thematic allocation.
This puts it in contention with the even-more targeted INQQ India Internet & Ecommerce ESG-S UCITS ETF (INQQ). While HITC’s 0.65% TER is 21 basis points (bps) below INQQ’s, over the past year, HITC’s underlying has gained 31.1% versus 56% for INQQ’s benchmark, as at 4 March.
It will be interesting to see how HSBC AM’s candidate fares against the narrower, 25-constituent INQQ in future and also whether it can muster a sustained breakout versus broad Indian equities.
Andrew Merricks, portfolio manager at IDAD Funds, added: “It is certainly one for the future but when will that arrive and will India have its own 'magnificent seven'? Overall it is a good launch as it offers a way to segment the market that did not exist, allowing investors to take a position on a view if they want to.
“It differs from the product launched by HANetf, but having two options within a sector that did not have any at all 12 months ago, it can only be a good thing as it gives asset allocators greater choice."


