Analysis from Solactive has shown how a “comparatively simple” multi-asset portfolio of emerging market bonds and developed market equities can outperform a pure equity portfolio, reflecting the benefits of diversification.
The analysis undertaken by Sebastian Alber, from the fixed income product development team at Solacitve, provides some ammunition for the theory of diversification that has come under attack from some quarters since the financial crisis which suggested a greater level of correlation between asset classes in times of stress.
Jennifer Steding, head of the fixed income product development team at Solactive, said with ETFs often used as the building blocks for larger portfolios, it "seemed natural to us to examine the mechanics of a transparent and rules-based multi-asset portfolio".
To put together the case study, Alber used the Solactive GBS Developed Markets Large and Mid Cap USD index as the equity element of the portfolio and the Solactive USD EM Government and Govt Related index for the fixed income element.
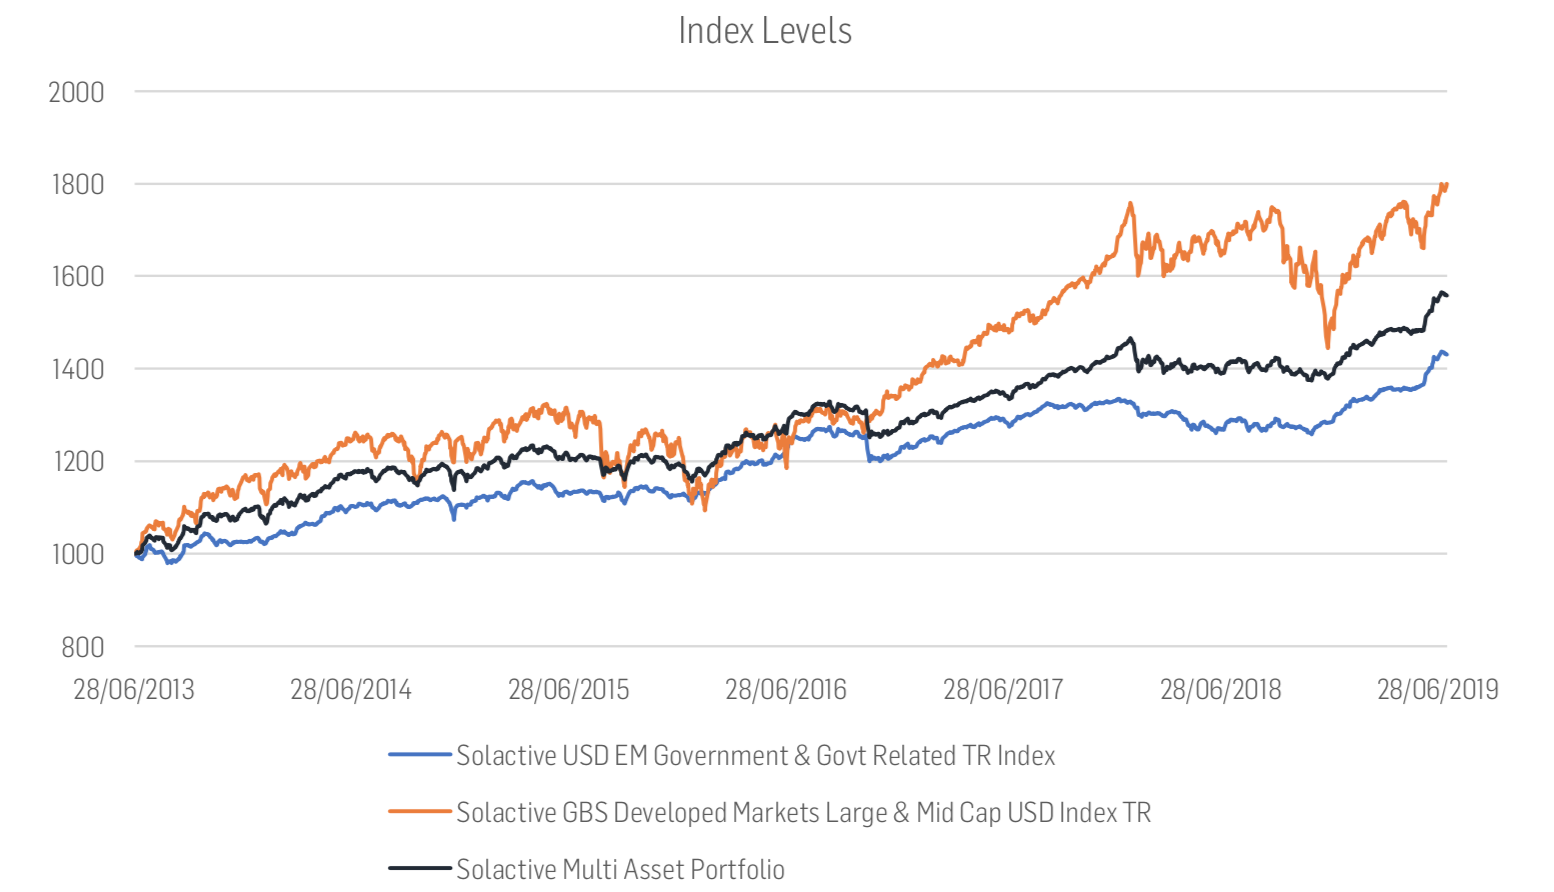
Alber said the equity portfolio has returned around 80% in the examined period between July 2013 and July 2019 while in the same period, the emerging markets fixed income portfolio showed a return of approximately 43%.
Risk evaluation
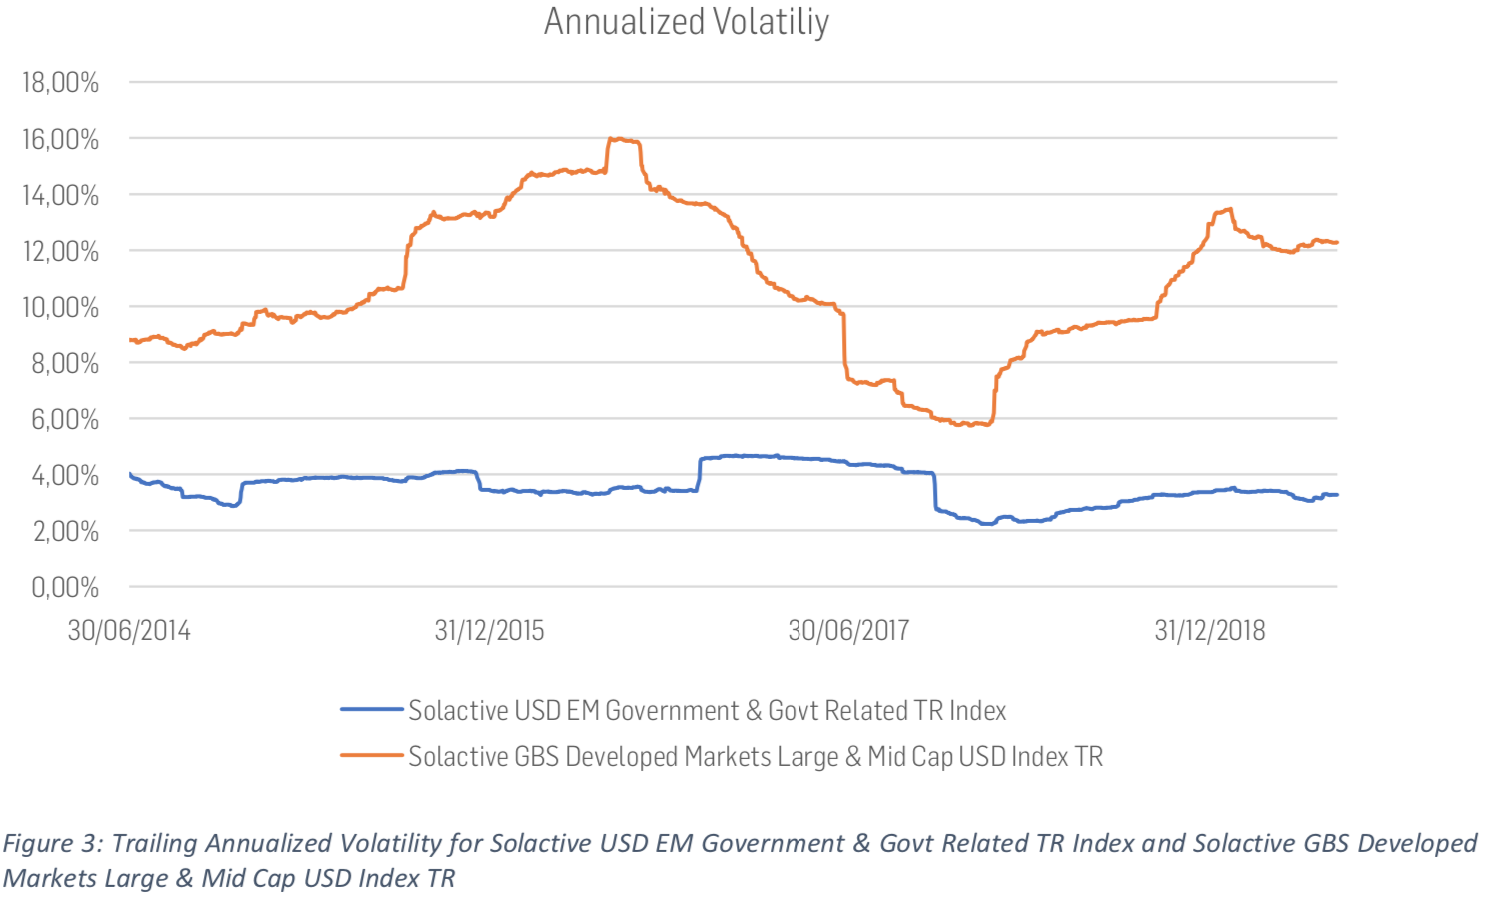
To evaluate the risk of a portfolio, Alber noted that typically the volatility metric of the portfolio is used. Volatility is a measure of variation and it indicates how much single values of a dataset deviate from its mean. “Within modern finance, volatility represents the most noted metric to measure risk,” Alber added. “Assets with a higher return or price volatility are considered riskier than assets with low volatility.”
In this case, the bond portfolio chosen duly delivered less volatility than the equity index. The expected return is approximated by the average daily return of each portfolio, calculated using an expanding lookback window.

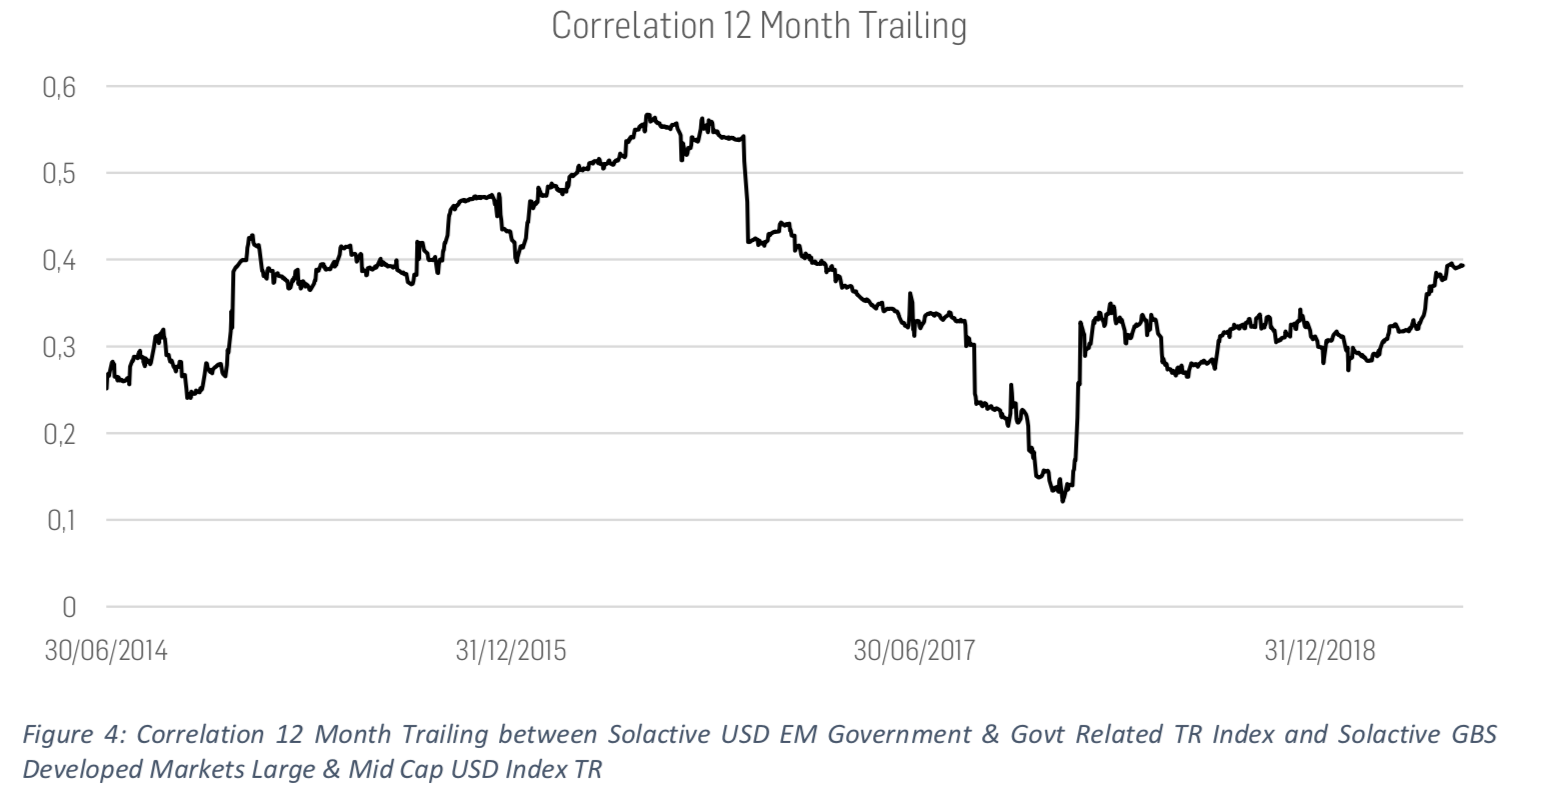
Another parameter for the optimal cross-asset portfolio is correlation.

As Alber pointed out, the optimal portfolio generally depends on personal risk and return preferences/tolerances of an investor but for this example the team chose a “relatively straightforward” Sharpe ratio using the annualized historical average return of our multi-asset portfolio and the annualized average volatility of the multi-asset portfolio of the last 252 trading days.
As the expected return and expected volatility depend on past daily returns, Alber said they jump-started the model in the first year and set the weights arbitrarily at 50/50 equity/bonds. Finally, Alber constructed the optimal portfolio and plotted its performance against both the all-stock and the all-bond sub-portfolios.

“Looking at returns alone (see chart above), the multi-asset portfolio performed worse than the equity portfolio but better than the fixed income portfolio,” Alber said. “However, we still can see that the risk level of the equity portfolio is larger than the one of the multi-asset and fixed income portfolios.”
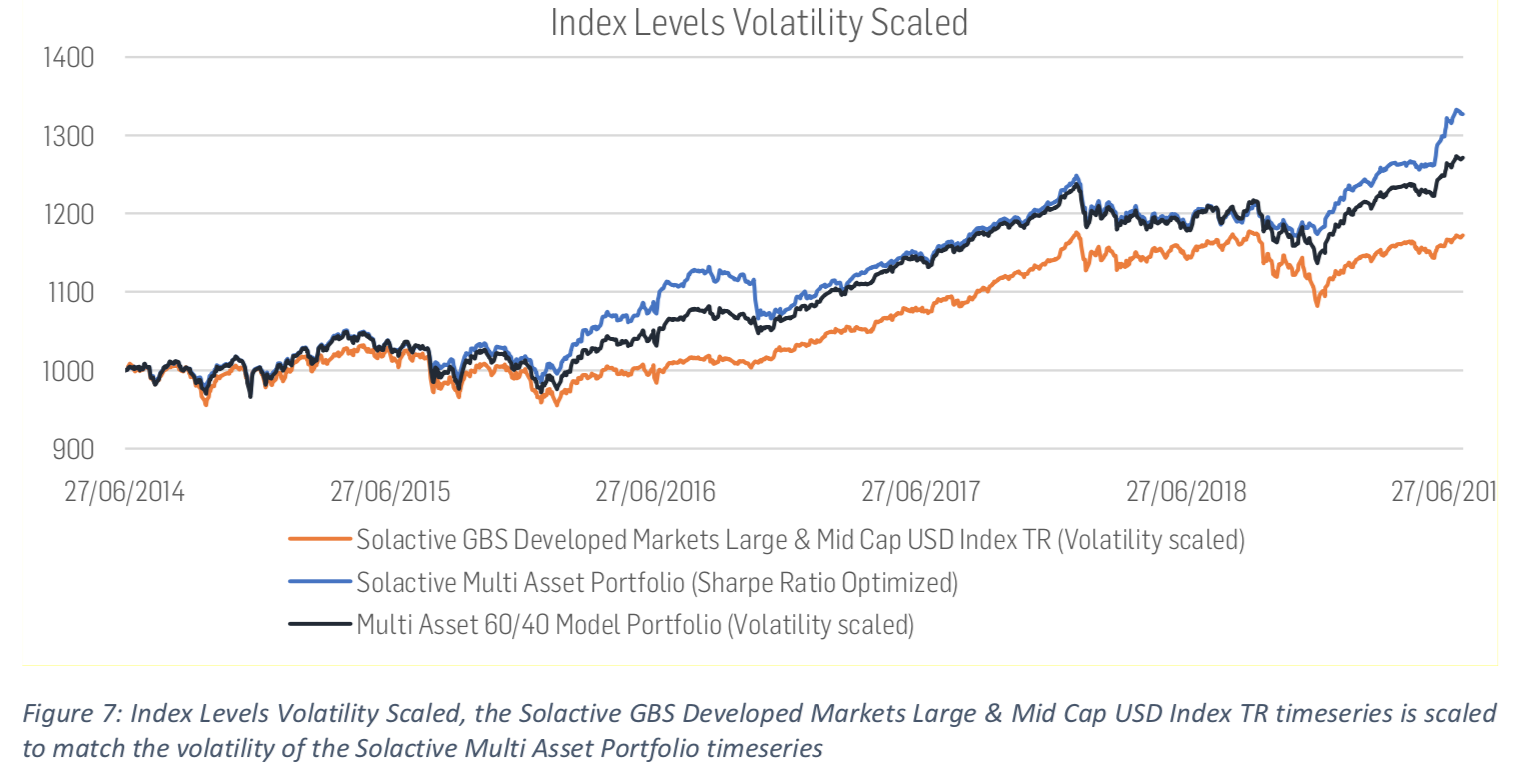
In order to make the equity portfolio more comparable to the multi-asset portfolio, Alber then used a technique called volatility scaling whereby a risky asset can be mixed with a zero-volatility asset in such proportions that the volatility of the combined portfolio reaches the desired level.
Alber matched the volatility of the equity portfolio with the volatility of the multi-asset portfolio and once completed, the returns of the two portfolios are comparable, and hence the team could judge which portfolio performed better on a risk-adjusted basis.

The conclusion is the comparatively simple constructed multi-asset portfolio consisting of emerging market government bonds and developed market equities managed to outperform the equity portfolio, reflecting the benefits of diversification.


