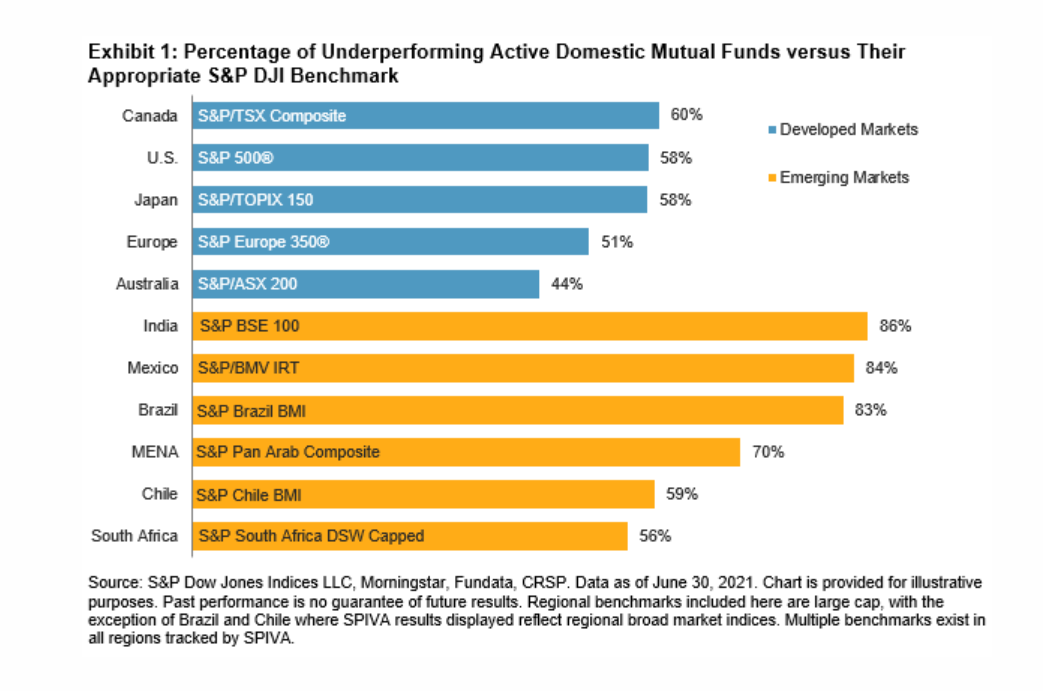
Active managers struggled to keep pace during the optimistic backdrop of H1 despite gaining some ground during last year’s COVID-19 pandemic volatility, according to S&P Dow Jones Indices’ SPIVA Europe mid-year scorecard.
In the 12 months through 30 June, 50.7% of euro-denominated and 37.9% of sterling-denominated Europe equity funds were outperformed by the S&P Europe 350, which is a marked improvement from 72.3% and 63.7% of funds failing to outperform the benchmark over a three-year period.
However, factoring in H2 2020 creates a very different volatility and returns profile to looking at the first half of the current year in isolation. Over the heavily risk-on setting of the first six months of 2021, active underperformance was once again pronounced, with 70.8% of euro-denominated and 61.8% of sterling-denominated European equity funds underperforming the S&P Europe 350.
This trend was also replicated across every other major regional exposure. Over the three year period, euro and sterling-denominated global equity funds underperformed the S&P Global 1200 by 83.1% and 69.9%. This then fell to 65.4% and 52.5% over the 12-month period and shot up again to 73.2% and 71.7% during H1 2021.
Similarly, in emerging markets equity funds, 74.6% and 63% underperformed over three years, down to 65.2% and 48.8% underperformance over one year and then back up to 73.5% and 71.8%, respectively, being beaten by their benchmark.
Finally, in US equity funds, 80.4% of euro-denominated and 71.9% of sterling-denominated products failed to beat the S&P 500 over the three years to 30 June. While these fell to 51.4% and 38.5% over the 12-month period, they predictably shot up once again to 64.8% and 57.1% in H1.

Source: S&P Dow Jones Indices
There were of course some exceptions to this rule, mainly in single country exposures. For instance, 40% of euro-denominated Italy equity funds failed to beat the S&P Italy BMI index over a 12-month comparison, with this number halving to 20.8% underperforming year-to-date through the end of June.
While giving up some ground, UK small cap exposures also remained a calling card for active managers, with just 16.1% of funds underperforming the S&P United Kingdom SmallCap benchmark in H1.
On the other hand, a previously strong area for active suffered a change of fates in 2021. While just 19.1% of UK large and mid-cap equity funds underperformed the S&P United Kingdom LargeMidCap over the year-long comparison, this transforms into 46.1% failing to outperform the benchmark when looking at the first six months of this year.
Overall, the latest SPIVA scorecard supports one of the favourite mantras of low-cost, passive proponents: active may outperform during periods of volatility but this outperformance is more difficult when equity markets move largely in tandem.
“The relatively better performance by active funds in 2020 was not sufficient to compensate for the long-term trend,” SPDJI said.
“The low market volatility experienced during the first half of 2021 affected fund performance dispersion as well. The interquartile range of the performance of Europe Equity funds was just 4.2%, whereas the same metric stood at 8.1% in 2020. This highlights that active funds generally performed more similarly to their peers in the calmer market environment.”
The picture is even more supportive to passive trackers when we take a more long-sighted view, given markets spend more time in periods of calm than they do in periods of high volatility.
In fact, on an absolute returns basis 95% of US equity funds underperformed the S&P 500 over the past decade, while at least 92% of global funds underperformed their benchmark, along with a minimum of 85.6% of emerging markets equity funds, 73.1% of European equity funds and even 61.5% of UK small cap equity funds. These comparisons were even more severe when viewed on a risk-adjusted returns basis.
“Every fund category saw its benchmark outperform at least 50% of the funds in the 10-year period, with averages greater than 80%,” SPDJI concluded.


