After a ‘lost decade’ spelled triple-digit underperformance for emerging markets, investors hunting for diversification and a comeback in developing economies may seek out ETFs such as those offered by BlackRock and Vanguard.
Emerging market equities have been ailed by a relatively strong US dollar since the Global Financial Crisis (GFC) and a capitulation in China more recently.
However, after the MSCI Emerging Markets index lagged US equities by 376% between 2011 and 2021, greater monetary policy headroom across some emerging economies and a dovish pivot by the Federal Reserve could put the product class back in focus.
Thankfully, investors are well-served for such an eventuality, with almost 130 ETFs offering broad exposure to every flavour of country, sector, equity and fixed income in emerging markets.
The first mover in the space was the now $2.7bn iShares MSCI EM UCITS ETF (SEMA), which launched in November 2005, two years before BlackRock acquired the iShares ETF suite from Barclays Global Investors (BGI).
In 2009, BlackRock complemented SEMA with an offering in its ‘Core’ range, the broader $19.4bn iShares Core MSCI EM IMI UCITS ETF (EIMI), which is now Europe’s largest emerging markets ETF by a clear margin.
Investors had to wait another two years for the world’s second-largest asset manager, Vanguard, to enter European ETFs and an additional year for the launch of the $2.6bn Vanguard FTSE Emerging Markets UCITS ETF (VFEG), which ranks as the seventh most popular ETF on the firm’s retail-focused UK Personal Investor Platform.
Beneath the bonnet
Looking at what makes the products tick and starting with BlackRock’s EIMI, the ETF physically replicates the MSCI Emerging markets Investable Market index and tracks 3179 large, mid and small-cap companies across 24 emerging markets.
Crucially, it sets itself apart from the veteran SEMA, which tracks the narrower headline MSCI Emerging Markets index of 911 equities.
EIMI relies on an optimised sampling methodology, meaning it applies “strategic selection” of physical equities, depository receipts or other derivatives to reduce creation costs and illiquidity, rather than buying all the physical components of its underlying index on a one-to-one basis.
Vanguard’s VFEG, meanwhile, captures 2111 large and mid-cap companies across advanced and secondary emerging markets by tracking the FTSE Emerging index.
Much like EIMI, VFEG captures a “representative sample” of the securities in its underlying index.
Where the products differ is what constitutes their respective MSCI and FTSE Russell benchmarks. For instance, while EIMI captures small cap stocks, this portion of the market is sidestepped by VFEG’s underlying index.

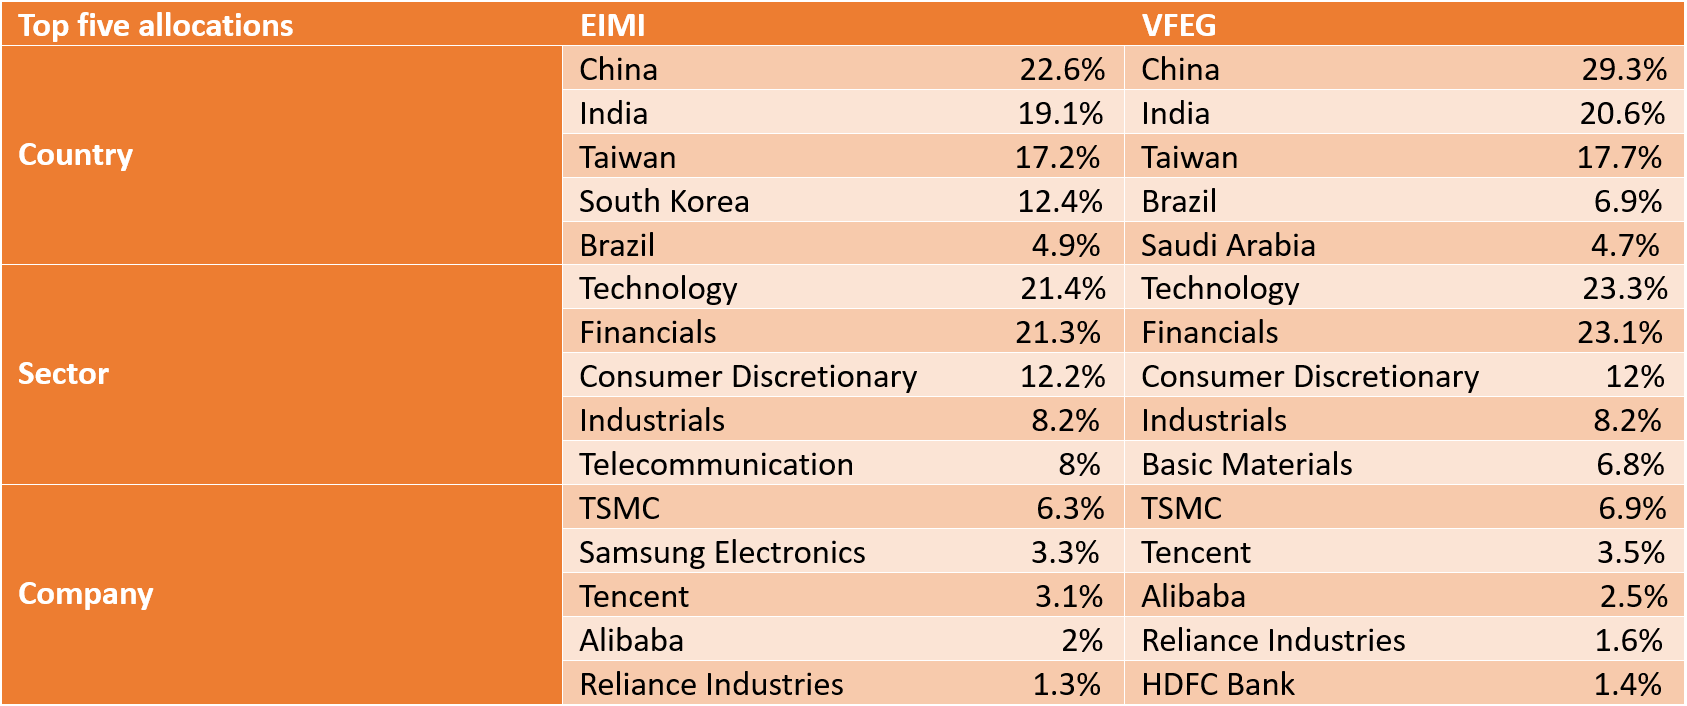
Another significant differentiator are country allocations. VFEG allocates 29.3% to China, an additional 6.7% weighting versus EIMI. It similarly awards an additional 1.5% to India and an additional 2% to Brazil.
Just as significant are the components VFEG omits. While EIMI allocates 12.4% to South Korean equities, the country is classified as a developed market by FTSE and therefore excluded from VFEG’s underlying. The same applies to Poland, which appears in EIMI’s basket.
The ETFs’ resulting universes of securities means VFEG allocates an additional 2.1% to the energy sector, 1.9% to tech, 1.8% to financials and 1% to utilities. Conversely, EIMI allocates 4% more to telecommunications and 0.7% to healthcare.
Drilling down to an individual constituent level, both ETFs award top weightings to Taiwan Semiconductor Manufacturing (TSMC), albeit with 6.3% and 6.9% weightings for EIMI and VFEG, respectively.
Both also feature Tencent, Alibaba, Reliance Industries, PDD Holdings, Infosys and HDFC among their top holdings, while EIMI’s South Korea allocation sees Samsung Electronics take the second-highest weighting of 3.3%.
In the field
In practice, the two differing conceptions of targeting emerging markets have naturally yielded differing results.
Over the three and five years to 6 February, EIMI claims a lead, with -18.9% and 15.7% returns, respectively, versus -19.6% and 11.8% for VFEG over the same periods, according to data from Bloomberg Intelligence.
Income investors would have enjoyed a slight edge with VFEG, which boasted a dividend yield of 2.58% in 2023 compared to 2.47% for EIMI.
However, this small victory is overshadowed when comparing the two ETFs’ total cost of ownership.
Not only is EIMI’s total expense ratio (TER) of 0.18% lower than VFEG’s 0.22% fee, but the rift in trading costs is even wider. While EIMI has a 0.05% spread on primary listing, VFEG has a spread 0.44%, according to Bloomberg Intelligence data.
EIMI also boasted 0.11% of securities lending returns last year – 62.5% of which is passed back to the fund – further offsetting the impact of costs by almost seven basis points. Vanguard notes that VFEG is able to engage in securities lending but does not disclose whether it has generated returns from these activities.
Overall, the numbers make the clear case for BlackRock’s candidate, with lower fees, higher returns, a more diversified basket and concurrently higher assets pouring into the ETF. For those not wanting exposure to emerging market small caps, or those philosophically opposed to defining countries such as South Korea and Poland as emerging markets, VFEG may also be of interest.


