Investors who seek to “do good” through their investment choices can potentially face trade-offs in their portfolios’ characteristics and outcomes. In this article, we illustrate the trade offs that investors with dual social and investment objectives must make when considering a carbon reduction constraint on a value manager.
Companies with attractive valuation multiples typically have high-carbon profiles so the opportunity set of low-carbon deep-value companies is limited and a preference for a low carbon intensity level in a value strategy leads to impractically high levels of concentration and illiquidity. Our findings indicate that investors should set realistic expectations when seeking to combine value investing and climate investing.
Sector bias in low-carbon investing
The primary source of greenhouse gas (GHG) emissions is the burning of fossil fuels, which is highly correlated with certain types of business activity. Consequently, a social objective of a reduced-carbon profile leads to making significant active sector bets such as allocations away from utilities (and basic materials and energy) companies and into technology (and telecom and financial) companies or other sectors with a low-carbon footprint.
From 2016 to 2021 – our study period – the very-high-carbon and very-low-carbon sectors became remarkably cheap and expensive, respectively. In this environment, if a decarbonisation requirement is in place, a value strategy struggles to maintain the desired position in undervalued companies.
Low carbon intensity vs deep value objective
To put the relationship of valuation and carbon intensity in context, we examined the carbon intensity levels of companies that have a high fundamentals-to-market ratio (i.e. a deep-value stock).
For each year, we ranked all stocks in the starting universe by its composite valuation ratio from high to low, then selected the top 10% of total market value (approximately 30% by count). We broke down this selection into tiers of carbon intensity and found that the majority of value companies have a high level of carbon intensity.
This illustrates the challenge imposed by the desire to decarbonise a deep-value portfolio – from 2016 to 2021 only 3% or less, on average, of the total market value of the 10% deepest-value stocks had attractive valuations and below-average carbon intensity. The opportunity set is extremely limited.
Carbon intensity’s relationship with size and momentum
The size and momentum factors suggest entirely different relationships with carbon intensity. Small-sized companies correlate strongly with deep-value companies because the size characteristic (market capitalisation) is in the denominator of the fundamentals-to-market ratios.
In contrast, high-momentum (high short-term return) stocks gravitate away from a deep-value classification as their prices outpace the trend of their fundamentals.
Decarbonisation portfolio analysis
We applied a simple process for constructing a deep-value low-carbon strategy. Our starting point was a naïvely constructed value strategy and we lowered the baseline portfolio’s carbon intensity using an iterative process of reallocating weights from those companies with high carbon intensity to their lower carbon intensity counterparts.

We limited reallocations to only those stocks in the baseline portfolio to preserve the value characteristics of the portfolio. Whether measured by the price-to-book ratio or the composite valuation ratio, the carbon-constrained value strategies stayed within 28% and 36% as cheap as the universe’s price-to-fundamentals multiple.

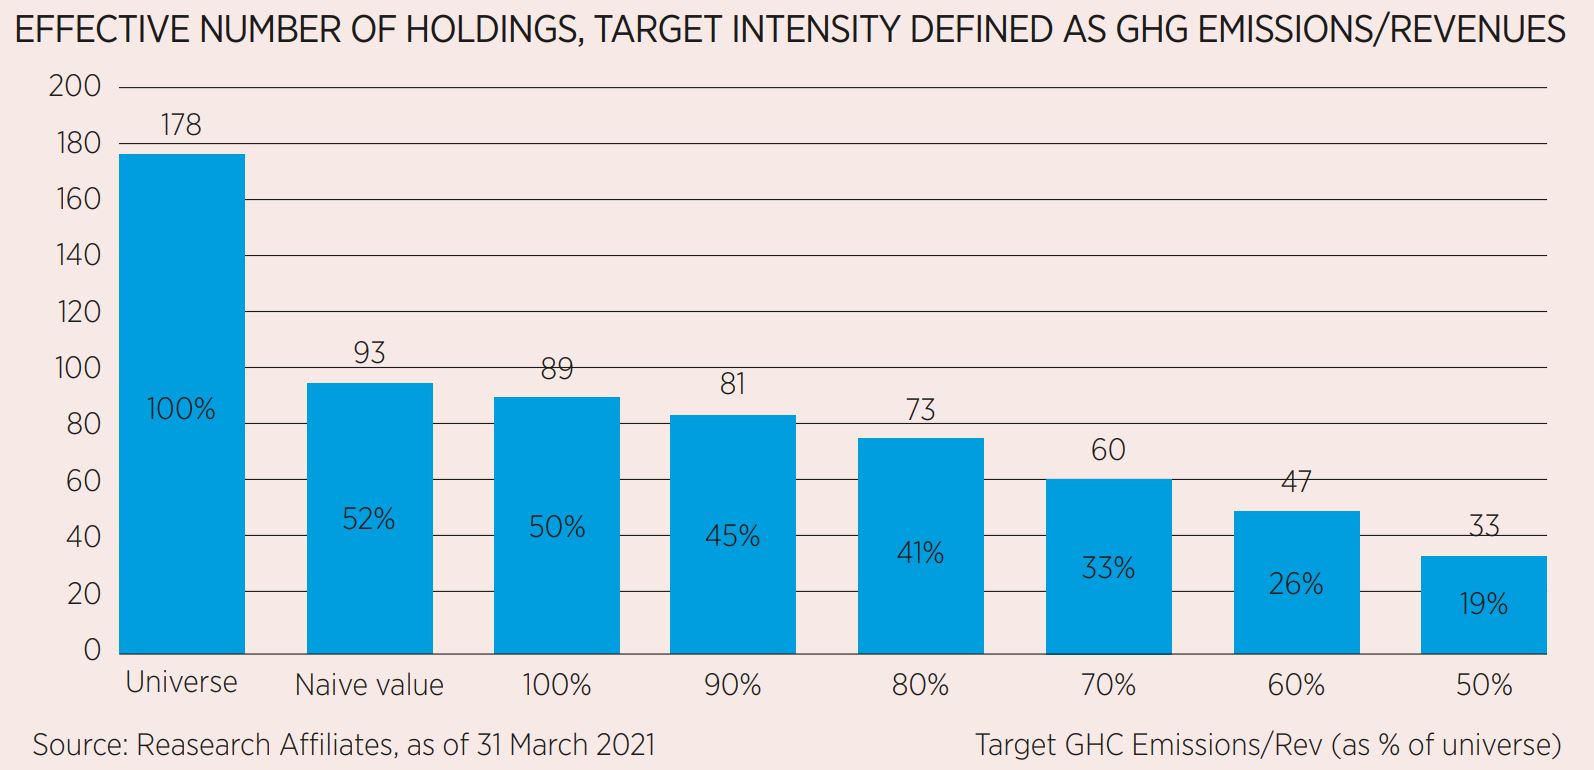
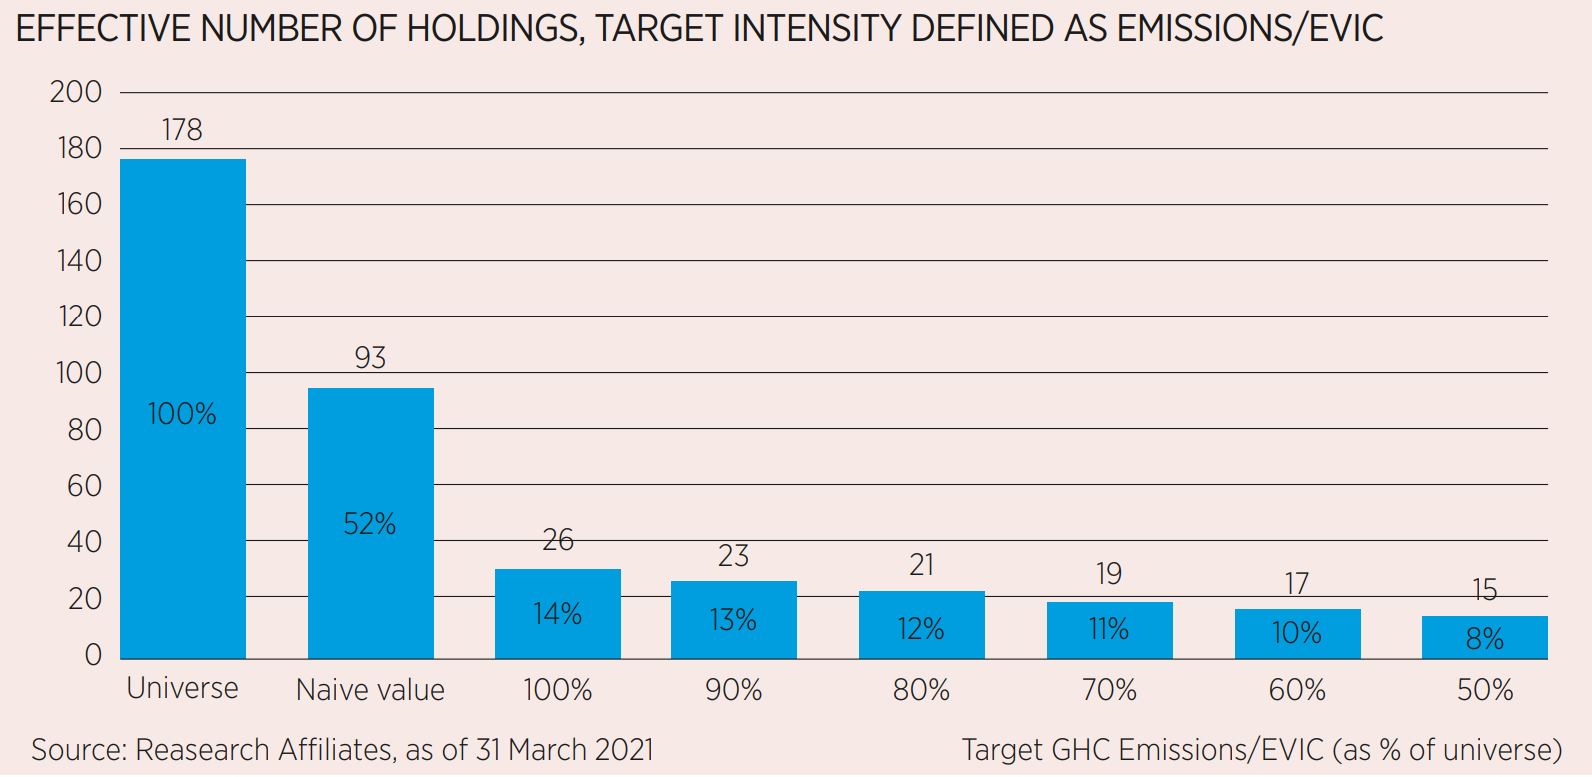
In theory, we should have been able to achieve the decarbonisation targets without harming the portfolio’s valuation but because of scarce availability of low-carbon and deep-value companies, the decarbonisation bias led to impractical portfolio characteristics. These portfolio characteristics – high concentration and low liquidity – were the key drivers of the transaction costs required to maintain the value strategies.

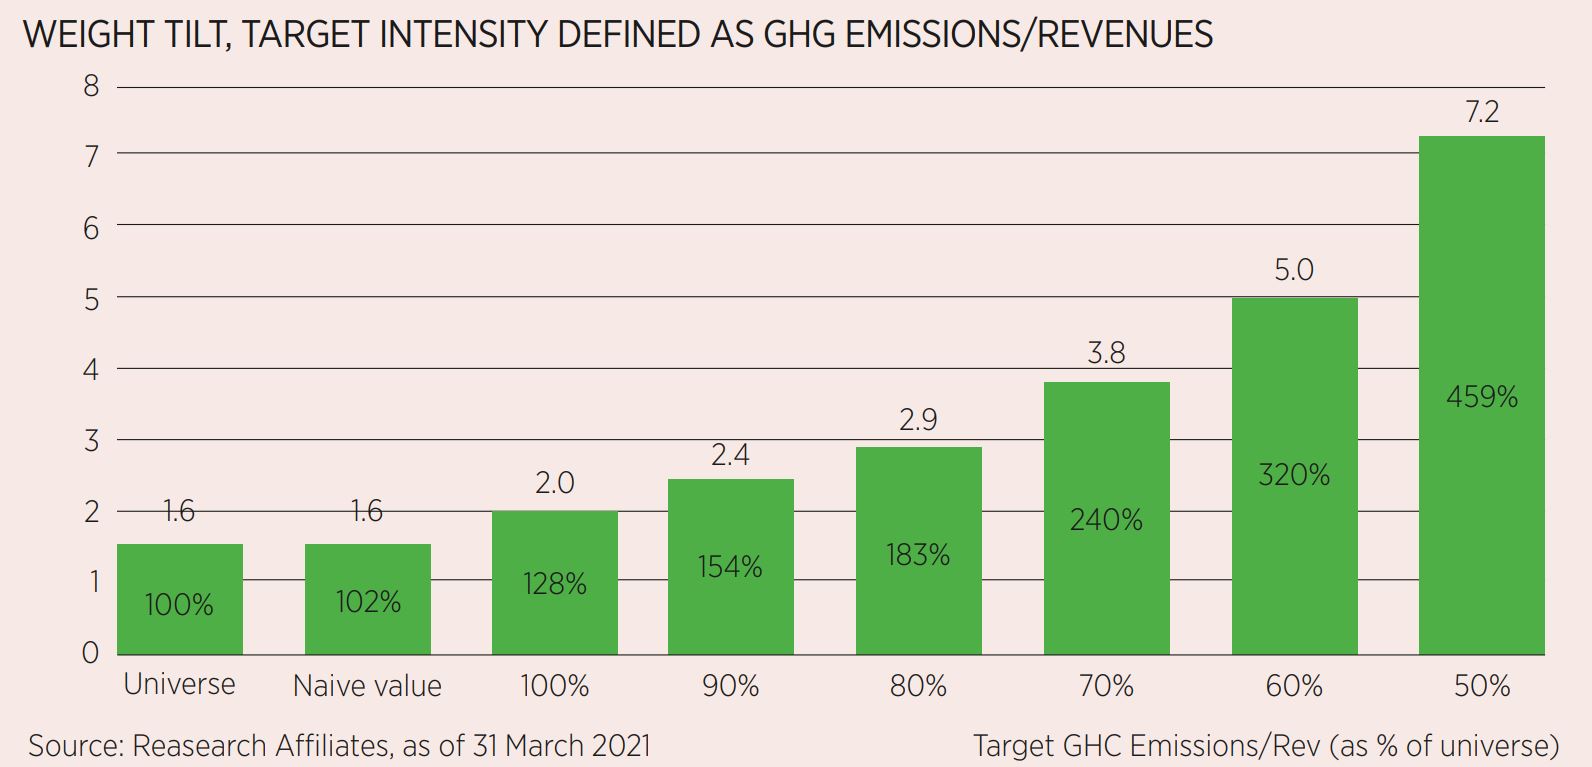
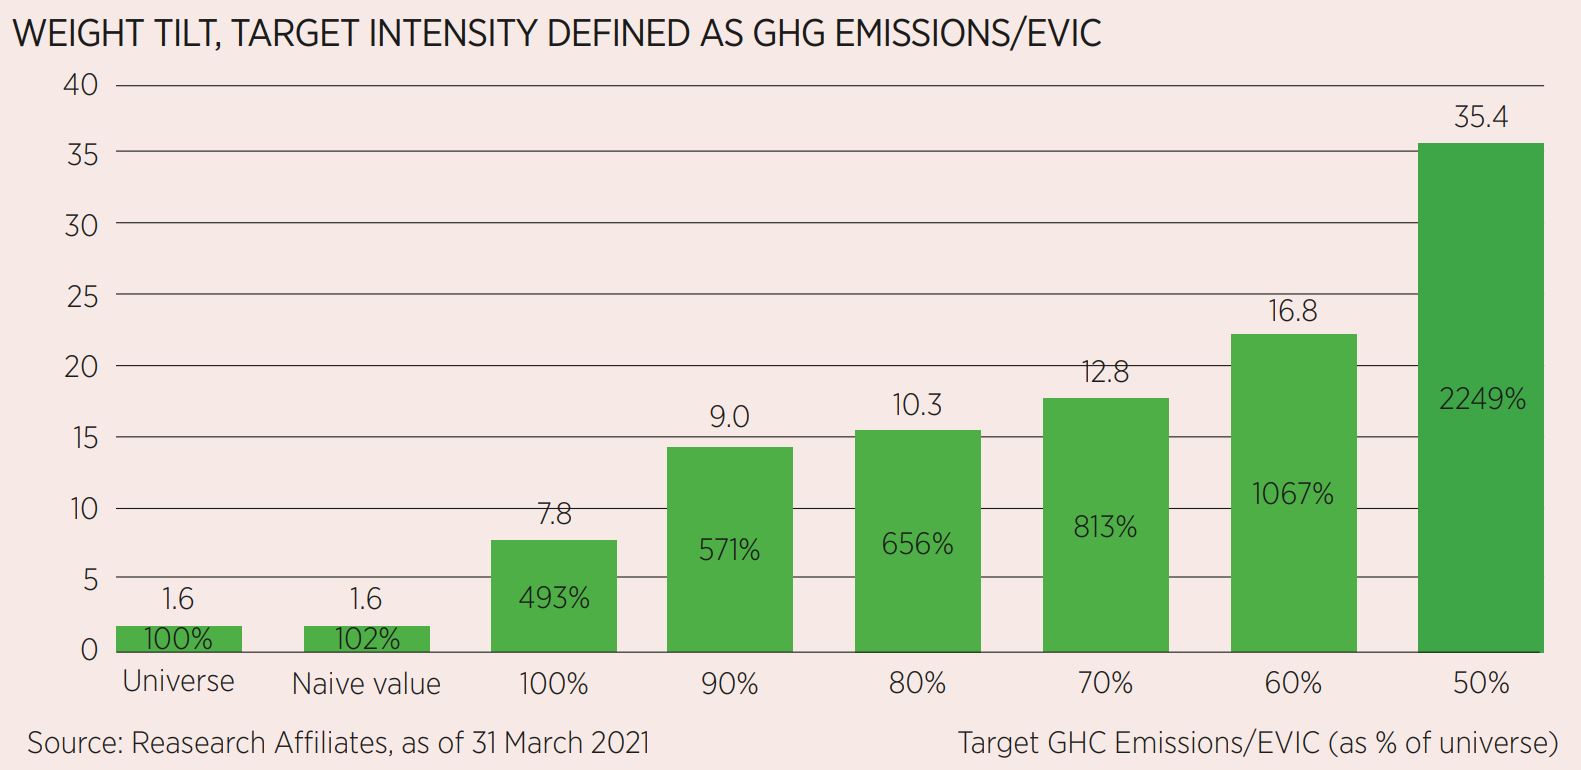
The weight tilt, defined as the average deviation from the trading-volume weight of the holdings, is a measure of portfolio illiquidity and increased with higher allocations to less-liquid holdings. The universe and the naïve value strategy were weighted by market cap, which is highly correlated to liquidity, resulting in a low weight tilt of 1.6, as of March 31, 2021. The weight tilt increased rapidly with increasing restrictions on carbon, rising to 12.8 and 35.4 for the 70% and 50% targets, respectively, which complied with the EU benchmarks. Assuming a similar average turnover rate, the costs of rebalancing the value strategy at these decarbonisation levels were eight times (12.8/1.6) and 22 times (35.4/1.6) more costly than the naïve value strategy!

If the expected excess return of the baseline value strategy was not more than eight times or 22 times the expected transaction costs, the expected excess return is completely eroded by the low-carbon restrictions. In such a case, the investment objective and the social objective of this strategy cannot coexist.
Accordingly, we introduced implementation constraints to improve the characteristics related to transaction costs, so that running the value strategy became more practical. Unfortunately, when carbon reduction targets were measured using EVIC, because the baseline portfolio had immense carbon intensity of 345%, meeting the 70% and 50% targets was too difficult and the improvements were rendered unimportant.
When targets were measured using revenues, however, the resulting portfolios were able to successfully meet the targets.
The trade-off between doing good and doing well
Achieving a climate objective together with an investment objective (value) is not a trivial task. An investor seeking to satisfy both should consider relaxing their climate objective while making practical adjustments to the style- or factor-investing methodology they have selected to meet their investment objective.
In the case of a carbon intensity reduction objective, one possible trade-off is to use revenues (or other fundamental metrics) as the denominator for the carbon intensity calculation, because removing price in the formula can reduce the shift away from cheap stocks.
The investor could also select a more-relevant benchmark, such as a value index, for the 30% or 50% carbon reduction target. Doing so could help style managers and investors remain authentic to their investment objective while working to address their concerns about global warming.
When considering climate investing, investors should be conscious of how their social responsibility objective can impact their portfolio’s investment performance while also being conscious of how meeting their investment performance target can impact their carbon reduction goal.
Only through a detailed analysis of how best to balance the two goals, followed by a thoughtful portfolio construction process, can investors set realistic carbon reduction and investment goals to reach their preferred balance between “doing good” and “doing well.”
Ari Polychronopoulos is partner, head of product management and ESG at Research Affiliates
This article first appeared in ETF Insider, ETF Stream's monthly ETF magazine for professional investors in Europe. To access the full issue, click here.
Related articles


