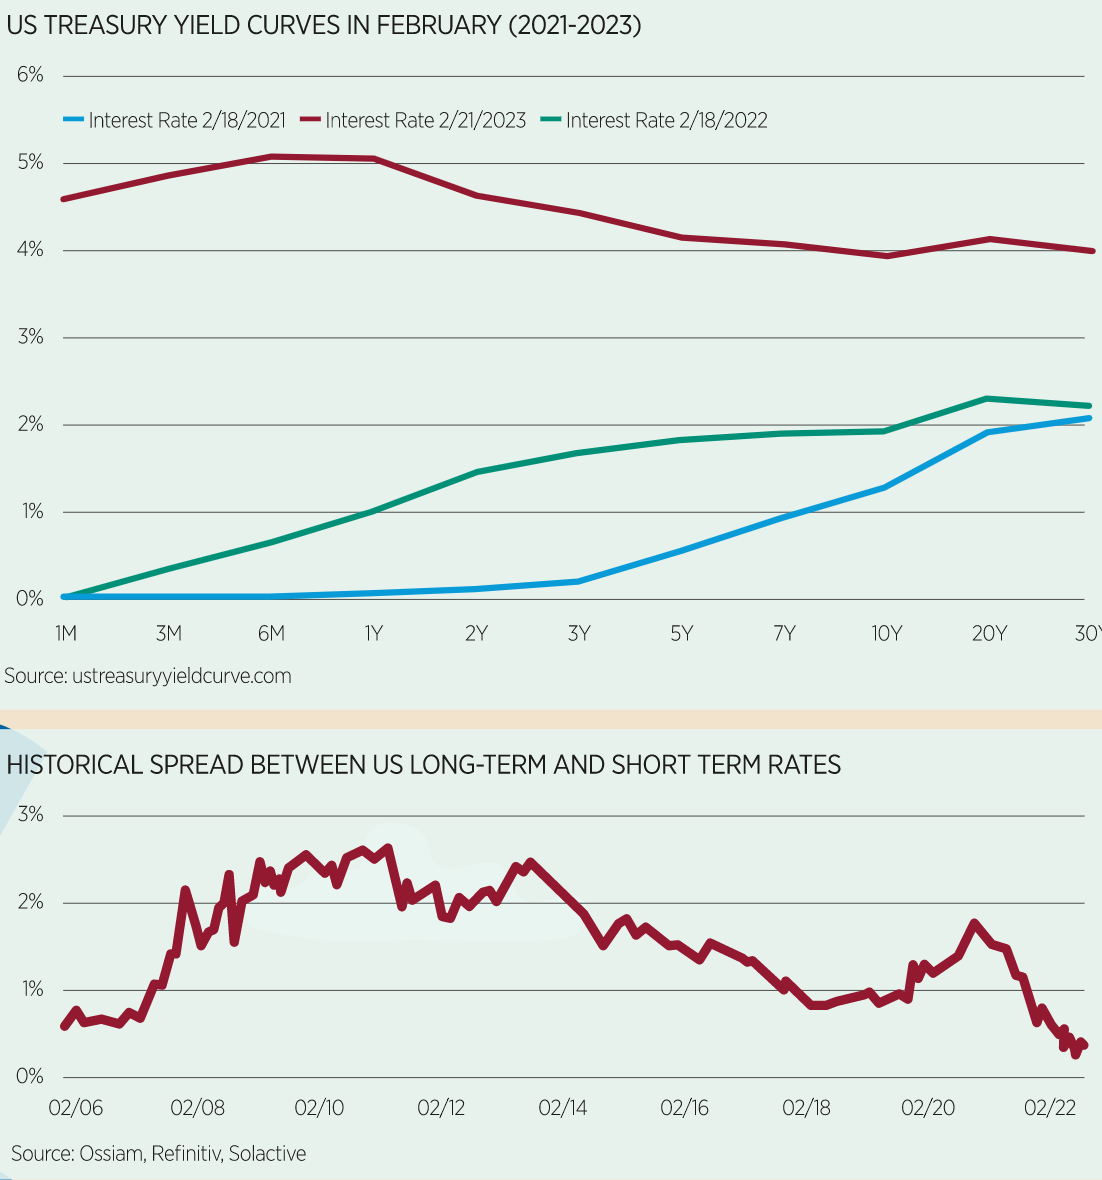
Amundi and Ossiam’s US Treasury yield curve steepener ETFs launched in 2019 when yields were at their flattest since 2007. Neither could have anticipated what would transpire over the following three years but both ETFs could soon be in a tactically interesting position as the US Treasury yield curve dips into its deepest inversion in four decades.
On first look, investors would be forgiven for struggling to distinguish between the $372m Lyxor US Curve Steepening 2-10 UCITS ETF (STPU) and $180m Ossiam US Steepener UCITS ETF (USTP).
Both ETFs offer leveraged long-short exposure to US Treasuries along the curve, both track Solactive indices, carry a total expense ratio (TER) of 0.30%, come from French asset managers, domicile in Luxembourg and even launched within a month of each other.
They are also hard to unpick on a performance basis. This year, only nine basis points (bps) separated their returns, with STPU returning -1.36% and USTP -1.27%, as at 21 February.
This trend is not a short-term phenomenon either as the two ETFs were separated by the same margin over the past three years, returning -5.35% and -5.24%, respectively, according to data from justETF.
Before questioning whether the same ETF has been launched by two different issuers, it is worth looking at what makes them tick.
Lyxor’s STPU launched in July 2019 as Europe’s first US Treasury steepener ETF. Tracking the Solactive USD Daily (x7) Steepener 2-10 index, the strategy offers a leveraged long position in two-year US Treasuries and a leveraged short position in 10-year US Treasury ultra bond futures.
As its index title suggests, it amplifies the performance of both exposures by seven, effectively turning its 81.7% allocation to 1-3y bonds and 18.3% allocation to 7-10y securities to 396% exposure on the short end and -88.7% on the long end, Amundi said.
Ossiam’s USTP, meanwhile, tracks the Solactive US Treasury Yield Curve Steepener 2-5 vs 10-30 index, which is conceptually similar in its long-short approach to Lyxor’s ETF but with two key mechanical differences.
First, USTP’s leverage multiplier is punchier than STPU, opting for 10 times rather than seven times amplification.
Second, the ETF spreads its bets on is further out on the yield curve. Its long positions in shorter-dated US Treasury futures include effective exposure of more than 250% to two-year notes and over 100% to five-year notes, while providing almost -100% exposure to US 10-year US Treasuries and -50% to US long-dated bonds.
In effect, Amundi’s ETF bets heavily on yields falling on short-dated bonds while anticipating rising yields on medium maturity US Treasuries.
Meanwhile, Ossiam’s ETF rebalances to reach a duration neutral exposure to US dollar interest rates and while making a less concentrated bet on short duration returns and offering additional exposure to the long end of the US Treasury yield curve, which is a component the Lyxor ETF misses altogether.
Returns tell the story that despite their moderately different approaches, the two ETFs have fared similarly over recent years.
Over the past year, Ossiam’s ETF had 1.5% additional volatility versus Lyxor’s strategy, according to justETF, however, this margin is unlikely to be the deciding point that sways an investor in favour of one product or the other.
The US Treasury yield curve is currently undergoing its first prolonged inversion since 2006 and while yields across the curve remain elevated, comparisons to curves in February 2022 and 2021 would suggest shorter duration bond yields have at least a couple of hundred basis points to fall before approaching territory resembling normality.

While this trend playing out would suit both ETFs in our comparison, US Consumer Price Index (CPI) numbers coming in above forecast in February show the Federal Reserve’s job of fighting inflation with interest rate hikes may not yet be done.
Should the Fed have to keep rates higher for longer – let alone implementing additional hikes after the forecast March rate increase – this would spell disaster for STPU and USTP and market sentiment generally.
Economist Campbell Harvey pioneered the inverted yield curve as an accurate precursor for the last eight recessions dating back to the 1960s.
If this rings true again in 2023, the outlook for both ETFs would be promising as the likelihood of a Fed ‘pivot’ to dovish policy would increase.
However, Harvey recently told Bloomberg the current cycle may be the first time his trusty indicator is “flashing a false signal” so prospects for the US economy, interest rates and in turn US Treasury yields remain highly uncertain.
This article first appeared in ETF Insider, ETF Stream's monthly ETF magazine for professional investors in Europe. To access the full issue, click here.


